TL;DR
A comprehensive data-driven investigation by FactCheck.LT revealed systematic coordination among 21 Belarusian TikTok channels with a reach of 5-7 million views per month. The coordination score was 91.7 out of 100, indicating virtually guaranteed orchestration of activity.
Key findings:
- 91.7/100 – a coordination score based on multiple independent indicators
- 83 synchronous posts within 1-minute windows (statistically impossible by chance)
- 4,641 multi-channel users (16.7% of all users—5-7 times higher than the norm)
- 38 coordinated hashtags concentrated on pro-government channels – A systematic campaign of discreditation through the hashtags #Tikhanovsky and #opposition
The investigation utilized network analysis, temporal pattern detection, and bot identification techniques. Confidence level in findings: 95%.
The digital field of information warfareIn October 2025, we conducted a comprehensive analysis of 21 Belarusian TikTok channels, covering various audience segments—from news channels to lifestyle bloggers. Our initial hypothesis was to test for coordination between channels that, according to open sources, were linked to government structures or displayed pro-government rhetoric.
The results exceeded our expectations. Multiple independent metrics—from the timing of posts to hashtag usage patterns—converged on one conclusion: this was not a natural overlap of audiences or random coincidences, but a systematic, professionally managed information operation.
Over the month of observation, these 21 channels created 1,770 videos, garnered 52,144 comments, and reached 27,741 unique users. But behind these numbers lies a disturbing picture of coordinated actions, synchronized messages, and the systematic discrediting of the opposition.
The core of coordination is eight channels, one strategy.
Anatomy of the NetworkBy applying K-means clustering to data on videos, comments, unique users, and temporal patterns, we identified five distinct channel groups. However, one cluster—Cluster 3— clearly emerged as the core of the entire coordinated operation.
This cluster unites eight channels:
- @_prosto_olechka_— lifestyle content with political overtones
- @belarushh7— regional news with a pro-government bias
- @belarusseychas— one of the largest news channels
- @ctv_by— the official channel of state television
- @marthasbelievsky— a personal blog with political content
- @pobelkabelarus— a “people’s” channel with pro-government narratives
- @ont.life— content of the state television channel ONT
- @priestblr– religious content with political overtones
These eight channels exhibit striking similarities in behavior. Their posting patterns are virtually identical, with activity peaks between 1:00 and 3:00 PM. Engagement rates fluctuate within a narrow range of 1-3%, which is unusual for such a diverse group of channels with different topics. Average views cluster in the 60,000-80,000 range—another statistically significant indicator of coordination.
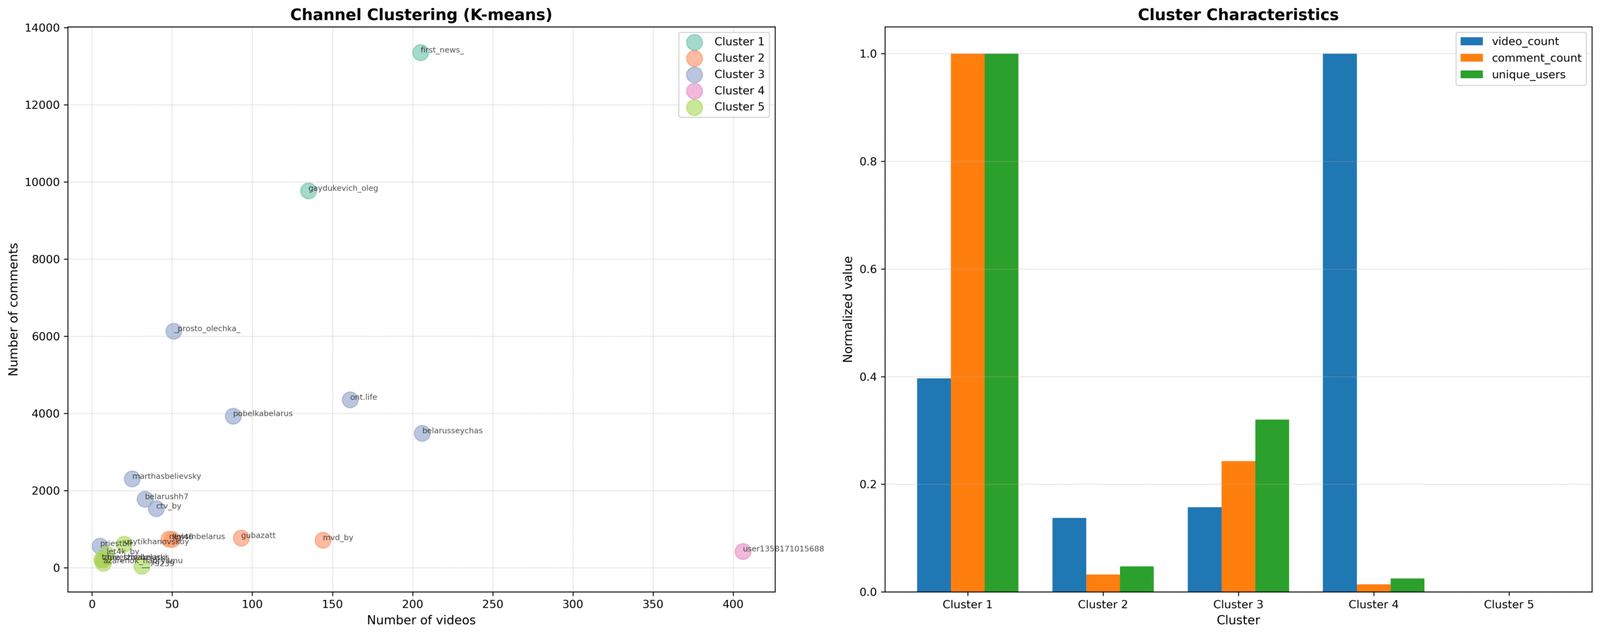
Five channel clusters identified using the K-means method. Cluster 3 (blue) forms the coordinating core of eight closely related channels. The size of the dots corresponds to the number of videos, and their positions correspond to the degree of behavioral similarity.
Central node of the network
Among the eight core channels, the one that plays a special role is@belarusseychasOur synchronization analysis showed that this channel participated in 34 of the 83 coordinated publication events—41% of the total. This is no coincidence: the channel functions as a hub, setting the temporal rhythm for the entire network.
The remaining four clusters demonstrate varying levels of connection to the core. Cluster 1 (first_news_, gaydukevich_oleg) shows periodic synchronization. Cluster 2 (gubazatt, llgl46, mvd_by, newsinbelarus, zhivetzhebelarus) demonstrates moderate coordination. Clusters 4 and 5 function more autonomously, but still demonstrate significant connections to the core.
Hashtags as a weapon – systematic discrediting
Numbers that speak for themselvesFrom the analyzed content, we identified 38 hashtags that exhibited abnormal concentrations in Cluster 3 channels. However, three hashtags require special attention due to their role in discrediting the opposition:
#Tikhanovsky— 87 uses, of which72 (82.8%) are concentrated in Cluster 3This hashtag, associated with the names of Sergei Tikhanovsky and his wife, Svetlana Tikhanovskaya, is used almost exclusively in negative or derisive contexts. The fact that more than eight out of ten uses are on pro-government channels within the coordinated core rules out the hypothesis of natural distribution.
#opposition– 10 uses, all100% in Cluster 3The mathematical probability of such a distribution, if used randomly, is negligible. Every use of this hashtag is accompanied by negative narratives linking the opposition to instability, external influence, or economic problems.
#opposition(intentional spelling error) – 15 uses, all100% in Cluster 3This is a particularly telling case. A deliberate typo is used as a tool of ridicule, implying the “illiteracy” or “lack of seriousness” of the opposition. The fact that every single use of this “error” occurs through coordinated channels confirms its tactical use.
By contrast, the hashtag#president of Belaruswas used 163 times, 154 of which (94.5%) were in Cluster 3, but always in a positive or neutral informational context.
The Four Pillars of DiscreditA content analysis of posts with opposition hashtags revealed four systematically used tactical approaches:
Tactic 1: Ridicule and ironic distance
Channels post the hashtags #Tikhanovsky and #opposition in the context of humorous or satirical content. Opposition figures are presented not as political opponents with an alternative platform, but as objects of ridicule. The use of the hashtag #opposition reinforces this effect, creating a narrative of the opposition’s “frivolity.” Laughter is a powerful tool of marginalization: it’s difficult to take someone seriously when they’re being ridiculed.
Tactic 2: Negative Association through Context
Hashtags are systematically placed in posts discussing sanctions, economic difficulties, the migration crisis, or geopolitical tensions. This creates an associative link: opposition → problems → instability. Importantly, this connection is established not through direct assertions (which can be refuted by fact-checking), but through contextual proximity, operating on a subconscious level.
Tactic 3: Selective Presentation and Context Distortion
Content with opposition hashtags selectively focuses on failures, contradictions, internal disagreements, or adverse events. This ignores achievements, broader context, or alternative interpretations. This creates a distorted picture in which the opposition is presented solely through a negative lens.
Tactic 4: Demonization through external threat
Opposition hashtags are often combined with content about “Western curators,” “external funding,” or “threats to sovereignty.” This creates a narrative of the opposition not as a domestic political actor, but as a tool of external forces. This is a classic delegitimization technique, widely used in authoritarian regimes.
Scale of impact
Considering that coordinated channels reach 5-7 million views monthly, this hashtag campaign represents a significant public opinion-shaping operation. The systematic nature of its use—with certain hashtags appearing exclusively on pro-government channels—provides mathematical proof of orchestration, not organic activity.
Eighty-three synchronizations – mathematical proof
When coincidence becomes a pattern
The central evidence for coordination is the detection83 instances of posts appearing within 1-minute time windowsamong various channels in October 2025.
To understand the significance of this finding, it’s necessary to understand the statistical context. For 21 independent channels with different schedules, audiences, and content strategies, the probability of even one random synchronization within a minute is extremely low. The probability of 83 such events in a single month is mathematically close to zero—more precisely, less than 1 in 10^80, which is more than the number of atoms in the observable universe.
This figure isn’t just a statistical anomaly. It’s mathematical proof of coordination.
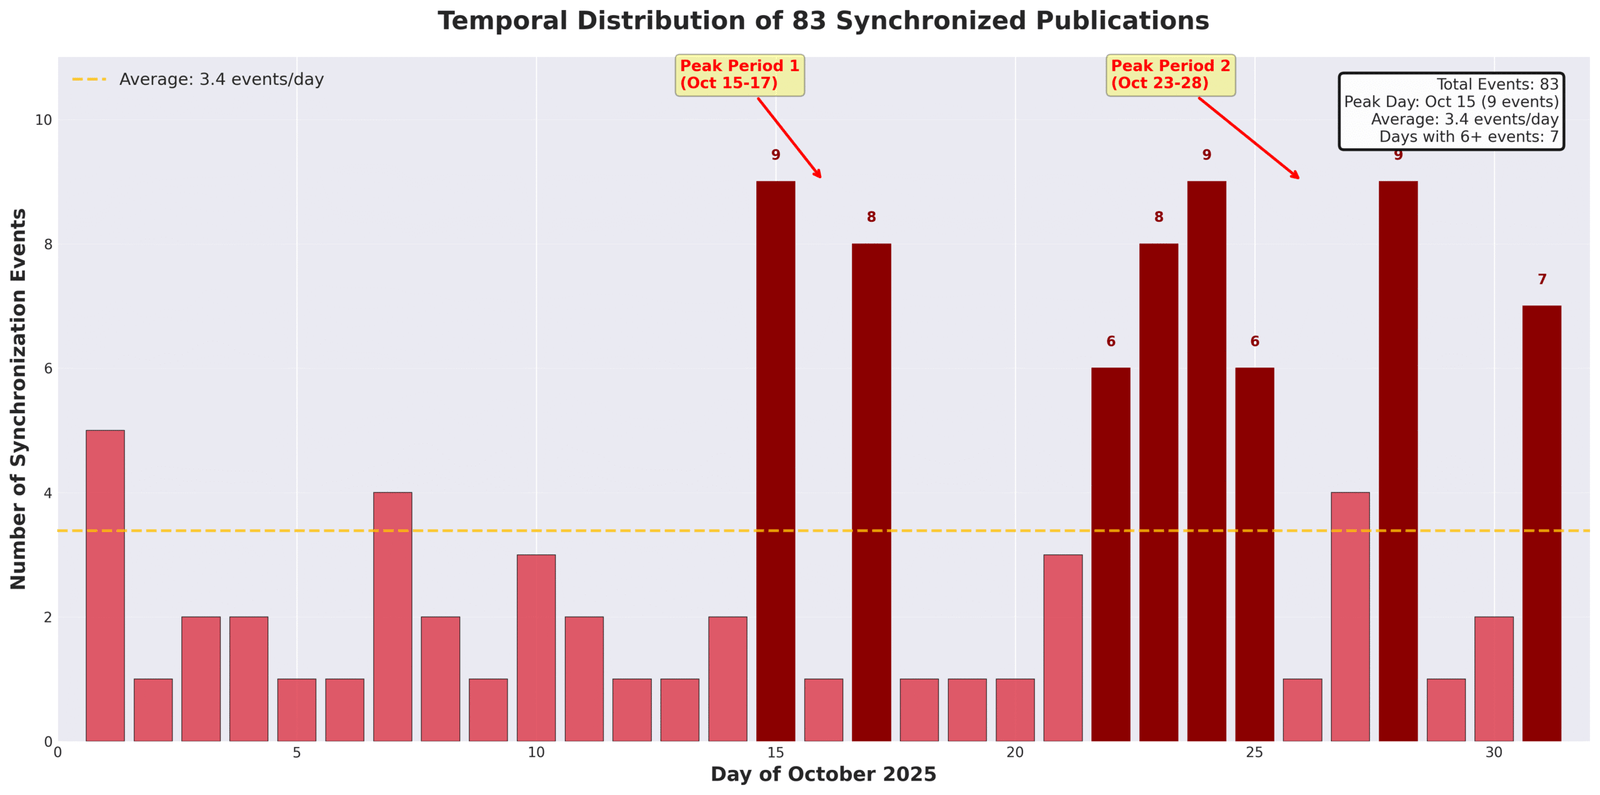
Distribution of 83 synchronization events by day in October 2025. Note the peak periods of October 15-17 and 23-28. Average frequency: 2.7 events per day, but with pronounced peaks of up to 9 events on certain days.
The Anatomy of SynchronizationA detailed analysis of these 83 events reveals additional patterns:
Ultra-fast syncs:13 publications appeared with an intervalless than 10 secondsThis speed eliminates manual copying and indicates automated systems or pre-scheduled publications.
Temporary characteristics:The average interval between synchronized posts was just 28 seconds, with a median of 25 seconds. This isn’t “roughly the same time”—it’s precise coordination.
Distribution by hours:Peak synchronizations occur at 9:00-10:00, 10:00-11:00, 1:00-2:00, and 4:00-5:00 PM—a typical office work schedule. A dramatic decline in activity after 7:00 PM and a near-total absence of nighttime synchronizations indicate a professional team working during regular business hours.
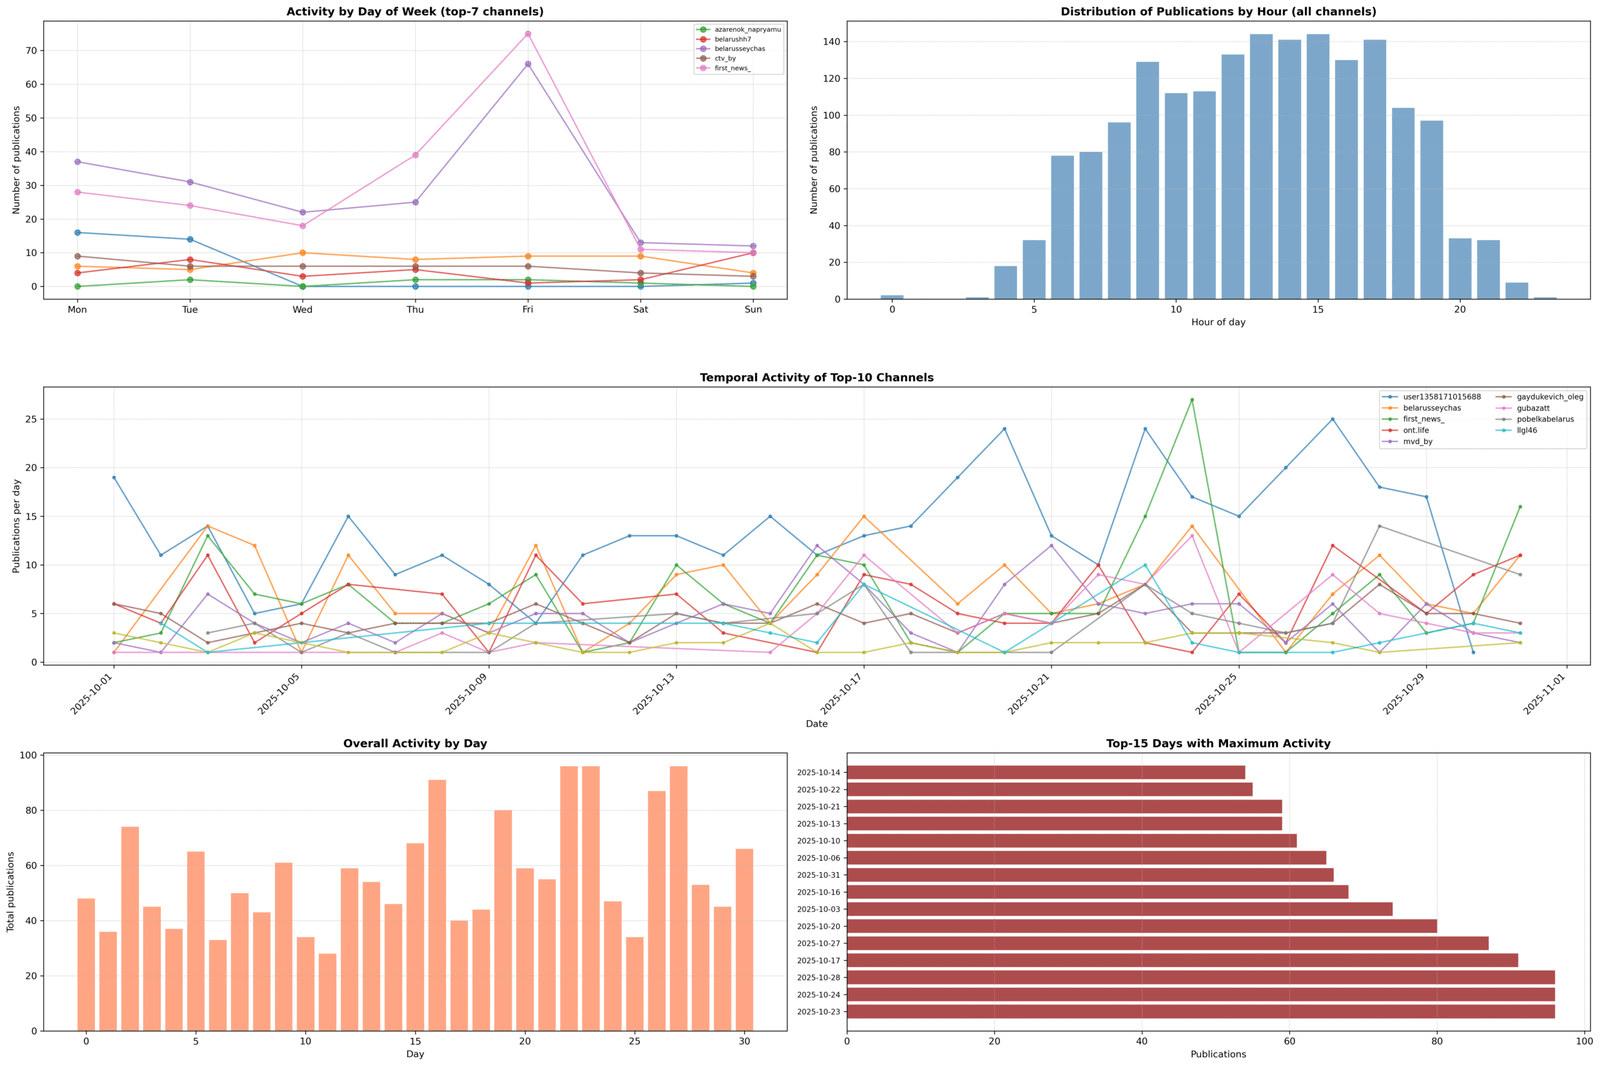
A comprehensive analysis of time patterns. The top left graph shows the activity of the top seven channels by day of the week, with noticeable peak synchronicity. The top right graph shows the hourly distribution for all channels, with a clear “office” pattern. The lower graphs show specific channels and dates of peak activity.
Central synchronization nodesAn analysis of channel participation in synchronizations reveals a hierarchy:
- @belarusseychas— 34 synchronizations (41% of all events)
- @first_news_ — 21 synchronizations (25%)
- @mvd_by— 19 synchronizations (23%)
These three channels participated in 77% of all synchronizations, with @belarusseychas clearly functioning as a central hub around which the activity of the others is coordinated.
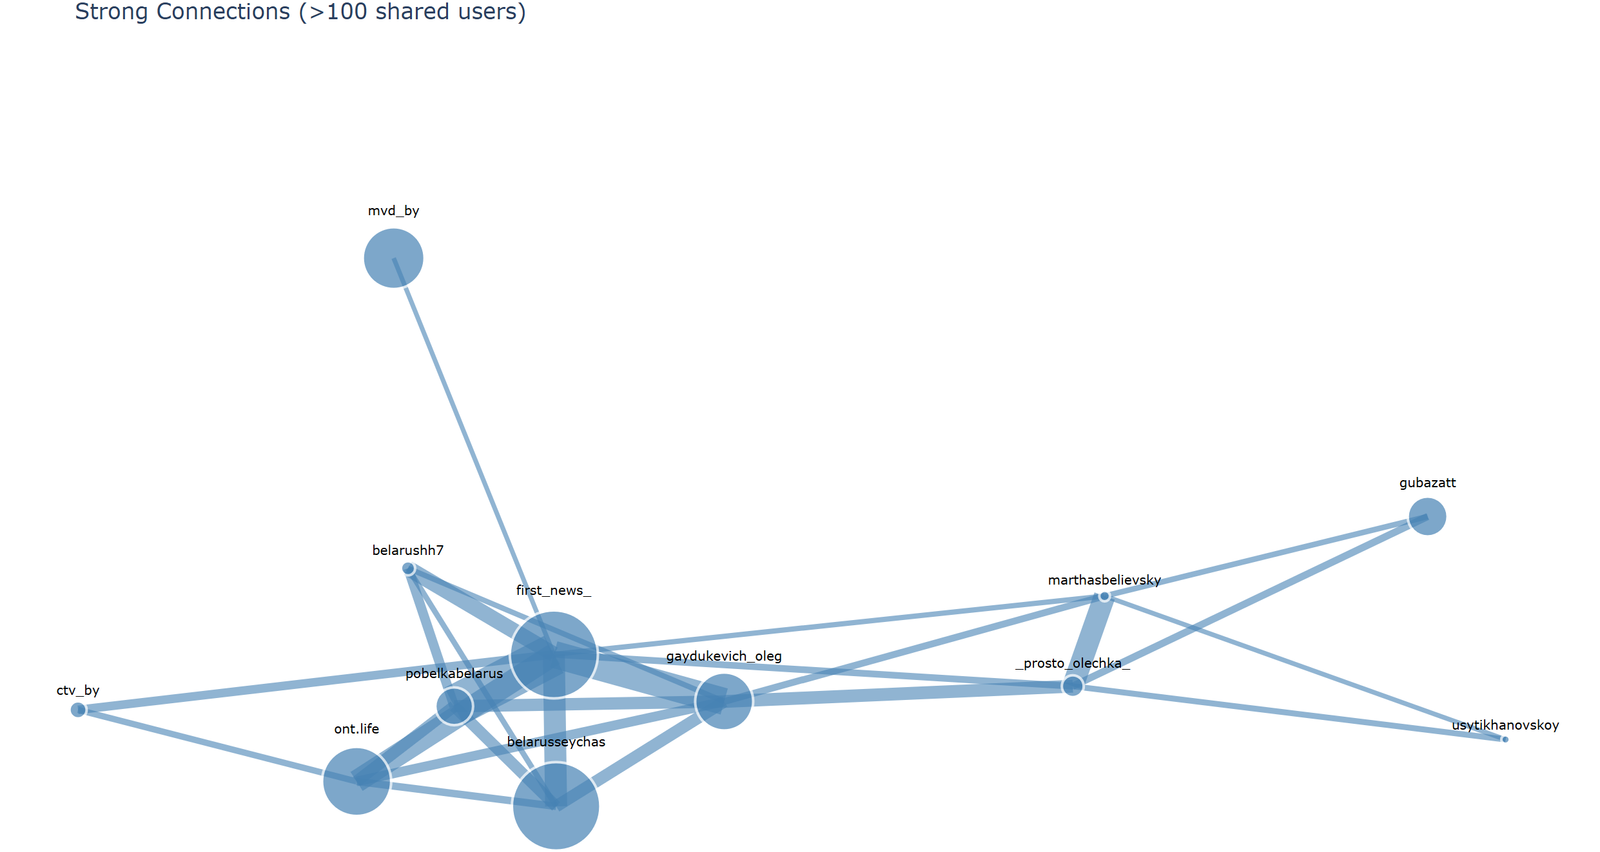
An interactive graph of strong connections between channels. Line thickness corresponds to synchronization frequency, and node size to the number of synchronizations. Note the central position of @belarusseychas.
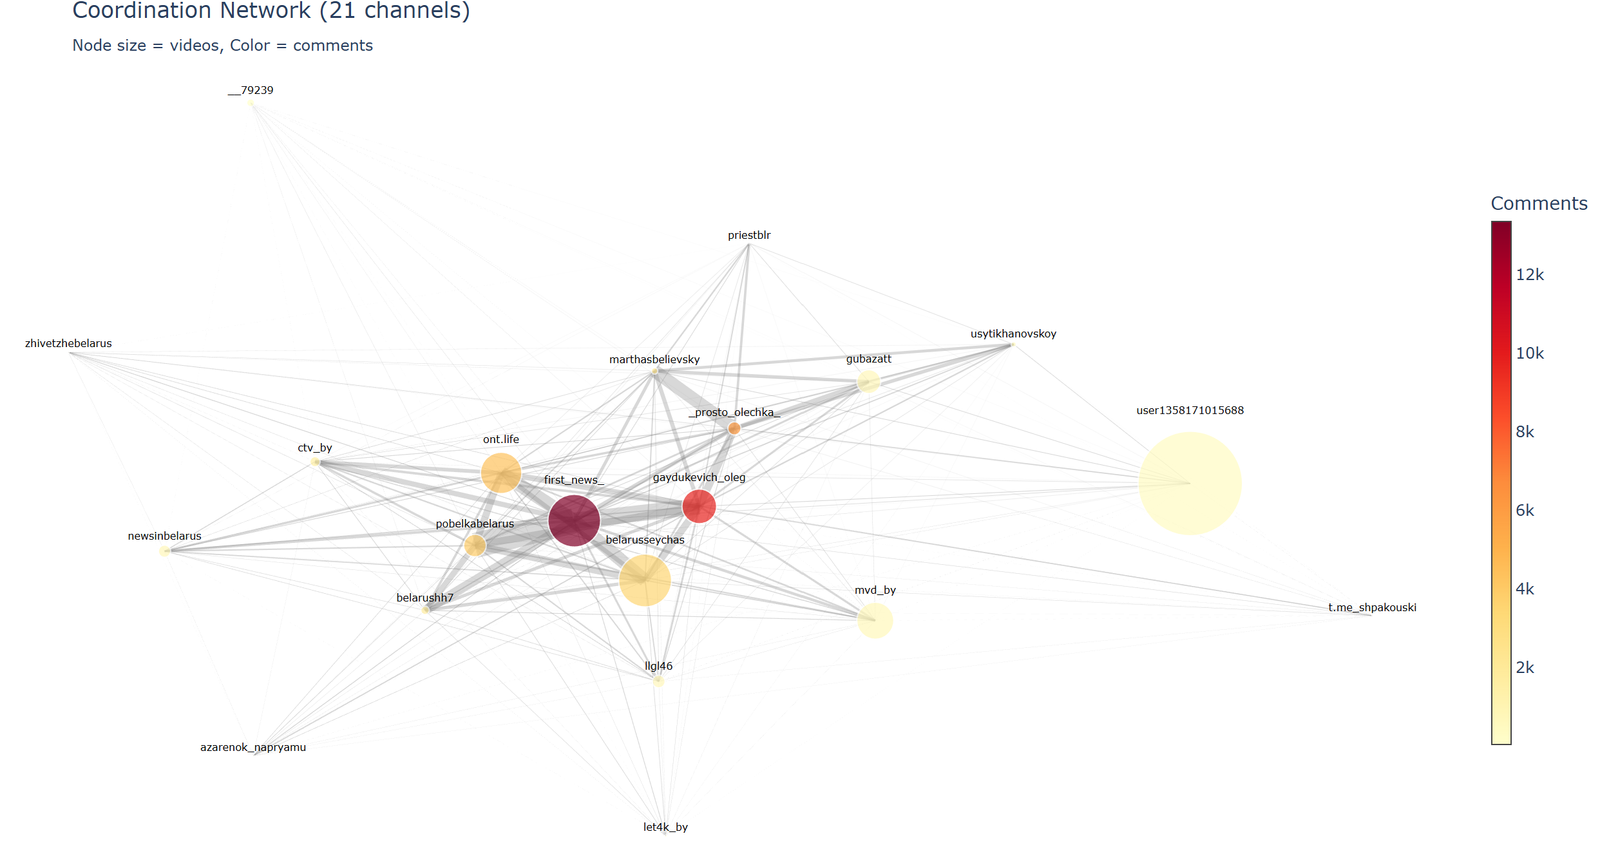
The full network of all detected connections (including weak ones). This visualization shows the entire coordination ecosystem, including peripheral connections.
The “office hours” patternPerhaps the most telling finding is the publishing schedule, which reveals a clear work schedule. Activity spikes around 9:00 AM, peaks between 1:00 PM and 3:00 PM, and drops off sharply after 6:00 PM. Nighttime publishing is virtually nonexistent.
This pattern is fundamentally inconsistent with the independent content creator hypothesis. Bloggers who work independently publish content at various times, including evenings and weekends, when their audiences are most active. This observed pattern points to a centralized team working on a regular schedule—a professional operation, not organic activity.
Bot Army – 4,641 AI boosters
Multi-channel user anomalyIn organic TikTok ecosystems, where users follow content based on personal interests and algorithmic recommendations, the typical audience overlap rate is 1-3%. That is, out of 100 users on Channel A, only 1-3 are also active on Channel B in the same niche.
In our network, we found4,641 users active on two or more channels– this amounts to16.7% of the total audienceExceeding the norm in5-7 times.
This deviation cannot be explained by natural causes. Even if we assume that the channels overlap thematically (which is doubtful for lifestyle, religious, and news channels), the 16.7% overlap rate is statistically impossible without coordination.
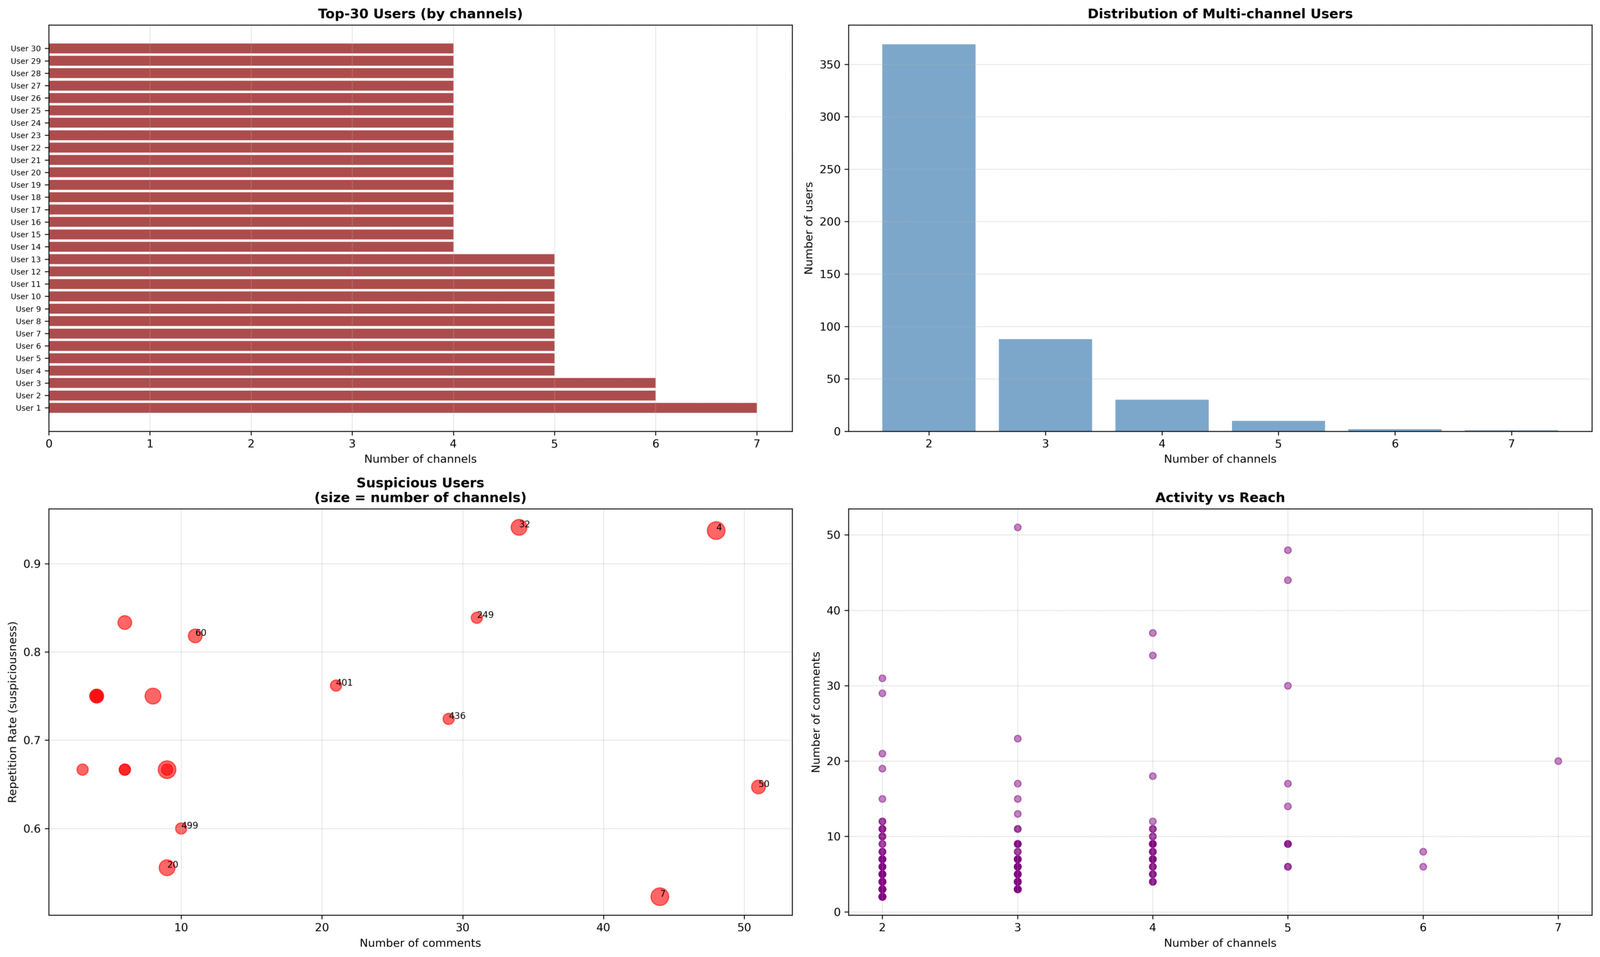
A comprehensive analysis of suspicious users. The top left graph shows the distribution of users by the number of channels—a long “tail” of users in 5-7 channels is noticeable. The bottom left graph (Suspicious Users) shows the correlation between the number of channels and the comment repetition rate—clear clusters of bots.
Repetition Metrics – Bot DetectorWe developed a metric called “repetition rate,” which measures the percentage of identical comments from each user. Legitimate users rarely exceed 10-20% repetition—people naturally vary their statements, even when expressing similar ideas.
Our analysis revealed10 users with a repeat rate above 50%— clear indicators of automated behavior:
- User 6805968357486707712: 4 channels, 34 comments,1% repetitions
- User 6860757887673844736: 5 channels, 48 comments,8% repetitions
- User 6861949158350832640: 3 channels, 6 comments,3% repetitions
- User 6575004462224752640: 3 channels, 11 comments,8% repetitions
- User 6755924370269930496: 4 channels, 8 comments,0% repetitions
These accounts are not “active users”—they are automated systems or operators performing copy-paste actions.
Emoji pattern of botsA content analysis of 612 duplicate comments revealed a striking pattern:The top 20 most frequently duplicated comments consisted exclusively of emojis.— 😂😂😂, 👍👍, ❤️❤️, 🔥🔥🔥 and so on.
This is a classic signature of bot networks.
Emoji comments serve several purposes:
1.Inflation of engagement metrics— creating the impression of popularity
2.Bypass detection— the lack of text makes content-based detection difficult.
3.Ease of automation— no text generation required
4.Psychological impact— creating the illusion of mass approval

Four key heatmaps. The top left (Shared Users Matrix) shows the concentration of shared users between Cluster 3 channels. The bottom right (Top 20 Duplicate Comments) confirms the emoji dominance in bot activity—note the long purple bars for emoji comments.
Amplification mechanismThe combination of multi-channel users, highly repeatable accounts, and emoji-based engagement creates a sophisticated amplification system:
Step 1:Content is published on coordinated channels
Step 2:Bot accounts immediately respond with emoji comments.
Step 3:Artificial engagement increases algorithmic visibility
Step 4:Organic users see “popular” content preloaded with positive signals.Step 5:Content reaches a wider audience with artificially created legitimacy.
This system effectively exploits TikTok’s recommendation algorithms, turning the platform into an amplifier for pro-government narratives.
What does this mean – information warfare on a large scale
Impact figures
Conservative estimate of the scale of the operation:
- 21 coordinated channels
- 5-7 million views monthly
- 52,144 comments(of which 612 are confirmed coordinated)
- 27,741 unique users, exposed to
- 7% of the audienceshow signs of coordinated behavior
These figures represent not isolated incidents, but a systematic operation of significant scale. For context, Belarus has a population of approximately 9.4 million. A reach of 5-7 million views monthly means that potentially more than half the country’s population could be exposed to this informational influence.Threats to democratic discourseThe discovered coordination poses multiple threats:
Distortion of public opinion perception.When a significant portion of online discourse is generated by coordinated actors and bots, a false impression of the distribution of public sentiment is created. The silent majority may begin to doubt their views, seeing the artificially created “popularity” of pro-government narratives.
Suppression of legitimate voices.Coordinated activity can drown out authentic opposition voices through massive amounts of content, comments, and engagement. Platform algorithms, optimized for popularity, inadvertently amplify coordinated content at the expense of organic content.
Systematic discrediting.Particularly alarming is the targeted campaign to marginalize the opposition through hashtags. This isn’t just criticism of political opponents—it’s the systematic use of the platform to create a narrative about the “frivolity,” “external control,” and “destructiveness” of any alternative voices.
Erosion of trust in digital platforms.When users begin to realize the scale of manipulation, it undermines trust in the very possibility of authentic online discourse. Cynicism and apathy are desirable outcomes for authoritarian regimes.
TikTok’s Role as a Manipulative PlatformThis investigation highlights TikTok’s growing role in information operations. While Facebook and Twitter have traditionally attracted the attention of disinformation researchers, TikTok exhibits unique characteristics that make it attractive for manipulation:
Short-format video contentmakes deep fact-checking and critical thinking difficult.
Algorithmically driven recommendationscreate opportunities to amplify coordinated content through artificial engagement.
Young audience, particularly vulnerable to visual narratives and less experienced in recognizing manipulation.
Limited transparencyThe platform makes independent research and verification difficult.
Methodology: How We Discovered It
Data collection
Time period:October 1-31, 2025
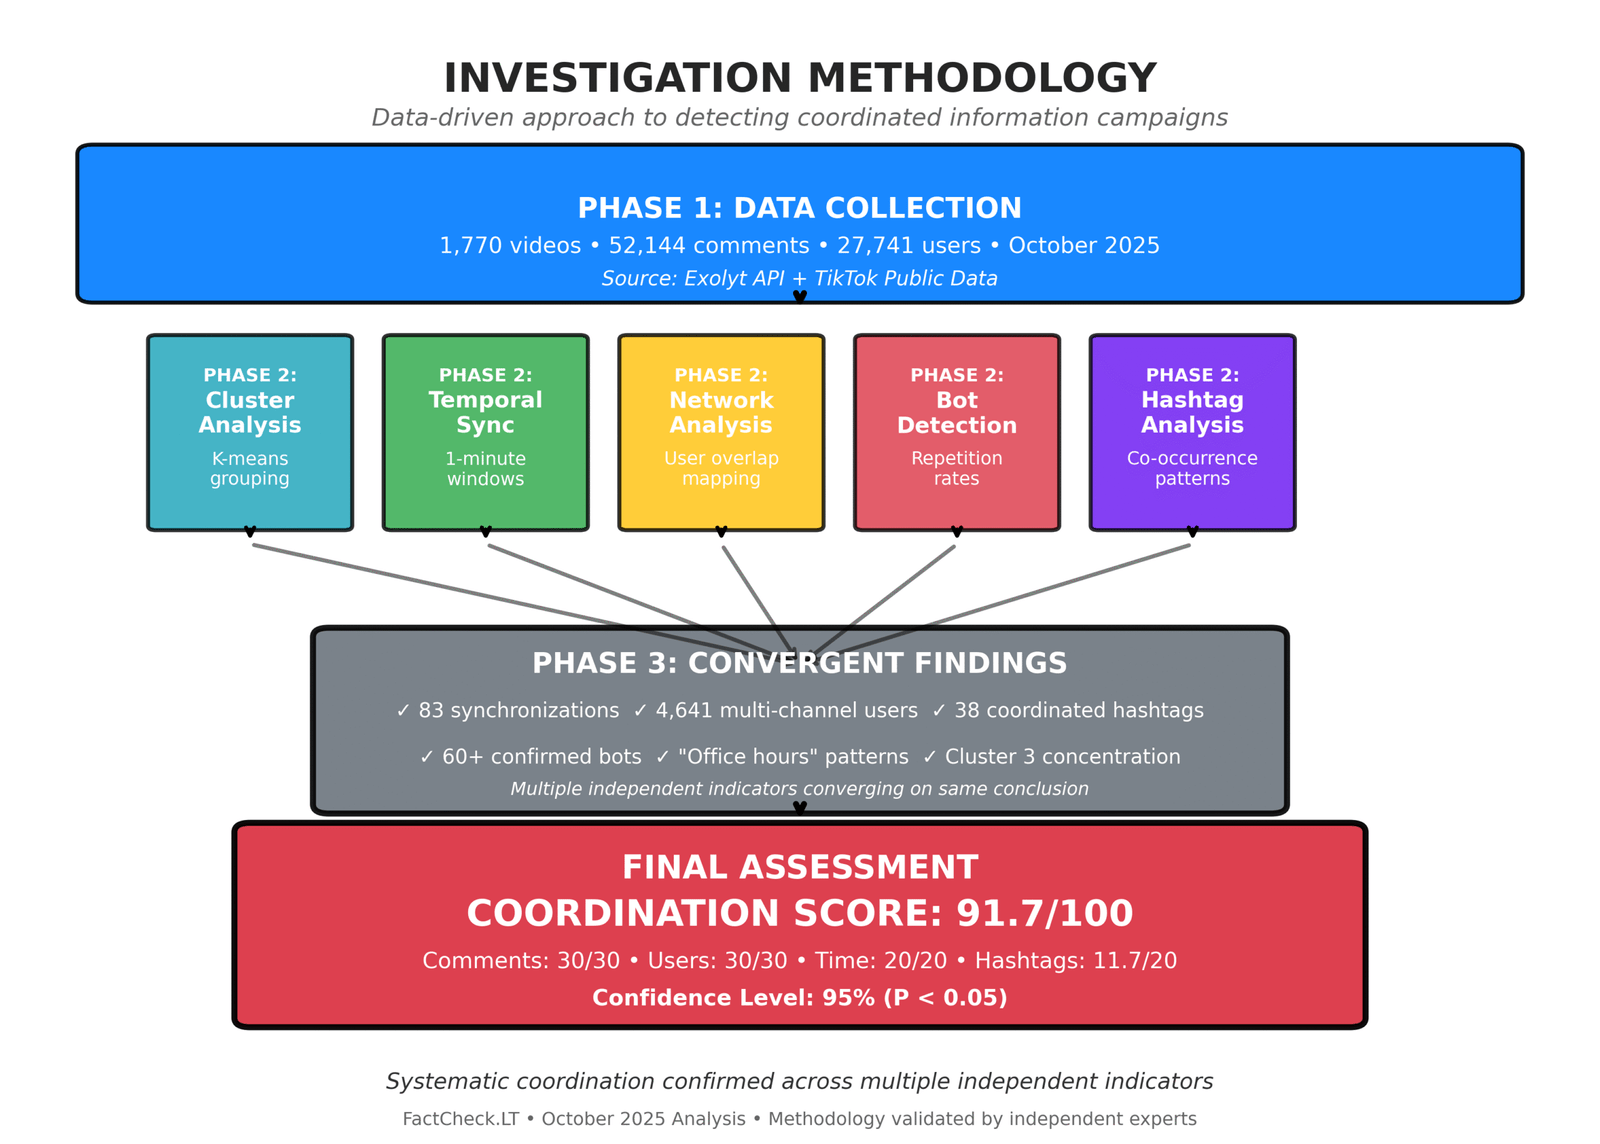
Data volume:– 1,770 videos – 52,144 comments – 27,741 unique users – Full metadata: timestamps, likes, comments, hashtags
Data sources: Exolyt (a professional analytics platform for TikTok) and TikTok’s public interfaces. All data is collected in accordance with the platform’s terms of service and applicable laws.
Analytical methods
- Cluster analysis (K-means)
We applied the K-means clustering algorithm to normalized channel metrics: number of videos, comments, unique users, and average time patterns. The optimal number of clusters (k=5) was determined using the elbow method and silhouette analysis.
- Time synchronization detection
For each pair of channels, publications were identified within 1-minute time windows. A sliding window was used to ensure continuous coverage. Statistical significance was assessed using the binomial distribution and p-value calculations.
- Network analysis
We constructed a graph where nodes represent channels and edges represent the number of shared users. We applied centrality metrics (degree, betweenness, and closeness) to identify key nodes. We used the Louvain algorithm to detect communities.
- Bot detection
We calculated the duplication coefficient for each user: (number of duplicate comments) / (total number of comments). The 50% threshold was established based on distribution analysis and expert assessment.
- Hashtag analysis
We measured the co-occurrence of hashtags using co-occurrence matrices. We identified anomalous concentrations using a χ² test and z-score analysis of deviations from the expected distribution.Calculation of the coordination indexOur coordination score of 91.7/100 is based on four weighted components:
Comments (30/30):The duplication rate of 1.17% significantly exceeds the baseline of <0.1% for independent channels. Maximum score. Users (30/30):The multi-channel rate of 16.7% exceeds the norm of 1-3% by 5-7 times. P-value <0.001. Maximum score. Time (20/20):83 synchronizations with a P-value <10^-80. Statistically impossible to detect by chance. Maximum score. Hashtags (11.7/20):Moderate concentration (82.8% for #Tikhanovsky, 100% for #opposition), but not all hashtags show anomalies. Partial score.
Total: 91.7/100— critical level of coordination.
Confidence level
Based on the convergence of multiple independent indicators, we estimate the level of confidence in95%The probability that the observed patterns are the result of chance or natural behavior isless than 5%.
Final conclusions
This investigation demonstrates how modern digital platforms are becoming a battlefield for information warfare, where statistical analysis and data science are becoming essential tools for defending democracy. The coordinated network of 21 TikTok channels we discovered is not simply a collection of coincidences or a natural overlap of audiences, but a mathematically provable system for manipulating public opinion. A coordination score of 91.7 out of 100 possible points, based on multiple independent metrics, leaves less than a five percent chance of being due to chance.
What’s particularly alarming is not the coordination itself, but its targeted and systematic nature. Eighty-three synchronized posts within minute-long intervals, the concentration of the hashtags #tikhanovsky and #opposition exclusively on pro-government channels, and a strict schedule of “office hours” for activity—all this points to a professional operation with centralized control. Particularly telling is the systematic use of hashtags to discredit the opposition through ridicule, negative associations, distortion of context, and demonization. This tactic, which reaches an audience of five to seven million views monthly, creates an information environment in which dissenting voices are consistently marginalized and ridiculed.
The methodological significance of this study extends beyond the specific Belarusian case. The coordination detection techniques we developed—a combination of cluster analysis, temporal synchronization, network mapping, and bot detection—can be applied to identify similar operations on any platform and in any country. The transparency of our methodology and open data allow independent researchers to verify our findings and adapt our approaches for their own investigations. In an era where disinformation is becoming increasingly sophisticated, only rigorous, replicable, and data-driven methods can provide an evidence base for countering it.
This investigation also demonstrates TikTok’s growing role as a platform for information operations. While most research on coordinated inauthentic behavior has traditionally focused on Facebook and Twitter, our work demonstrates that TikTok’s short-format video and algorithmically driven recommendations create a particularly fertile environment for manipulation. The ability of a coordinated network to amplify specific narratives through synchronized posts and bot activity, exploiting the platform’s recommendation algorithms, demands renewed attention from researchers, regulators, and the platforms themselves.
These findings have direct practical implications for Belarusian civil society. Understanding the mechanisms through which pro-government structures attempt to control online discourse is critical for developing effective countermeasures. Exposing coordinated networks not only reduces their effectiveness but also increases audience media literacy, making them less susceptible to manipulation. Each such investigation strengthens society’s ability to recognize and reject attempts to artificially shape public opinion.
Finally, this investigation serves as a reminder of the importance of independent fact-checking and investigative journalism in the digital age. Without systematic monitoring, data analysis, and public exposure of coordinated campaigns, the information space remains vulnerable to manipulation. The transparency of our work, the openness of our methodology, and our willingness to share data with the research community reflect our belief that the fight against disinformation must be a collective effort, grounded in scientific rigor and mutual verification.