

The second systematic publication based on AI analysis of 1,603 transcripts from five state-run YouTube channels. The share of content with signs of foreign information manipulation (FIMI) increased from 41.3% in January to 46.5% in February.
Why this study?
Belarusian state-run YouTube channels are a key tool for disseminating propaganda content to Russian-speaking audiences. Systematic monitoring of their content is not only a task for media research but also crucial for the security of the region’s information space.
The European External Action Service (EEAS) defines FIMI (Foreign Information Manipulation and Interference) as “a predominantly non-criminal pattern of conduct that threatens or has the potential to negatively influence values, procedures, and political processes” and is “manipulative in nature, carried out intentionally and in a coordinated manner.” We use this methodology to evaluate each analyzed transcript.
What’s new in the second publication
The January publication covered 908 videos and served as a pilot, testing a methodology for analyzing transcripts using a structured taxonomy of 20 propaganda techniques and 10 narrative categories. In February, coverage nearly doubled: 1,603 transcripts published by five state-run channels. A visual analysis of the thumbnails was also conducted, allowing for a comparison of textual and visual strategies.
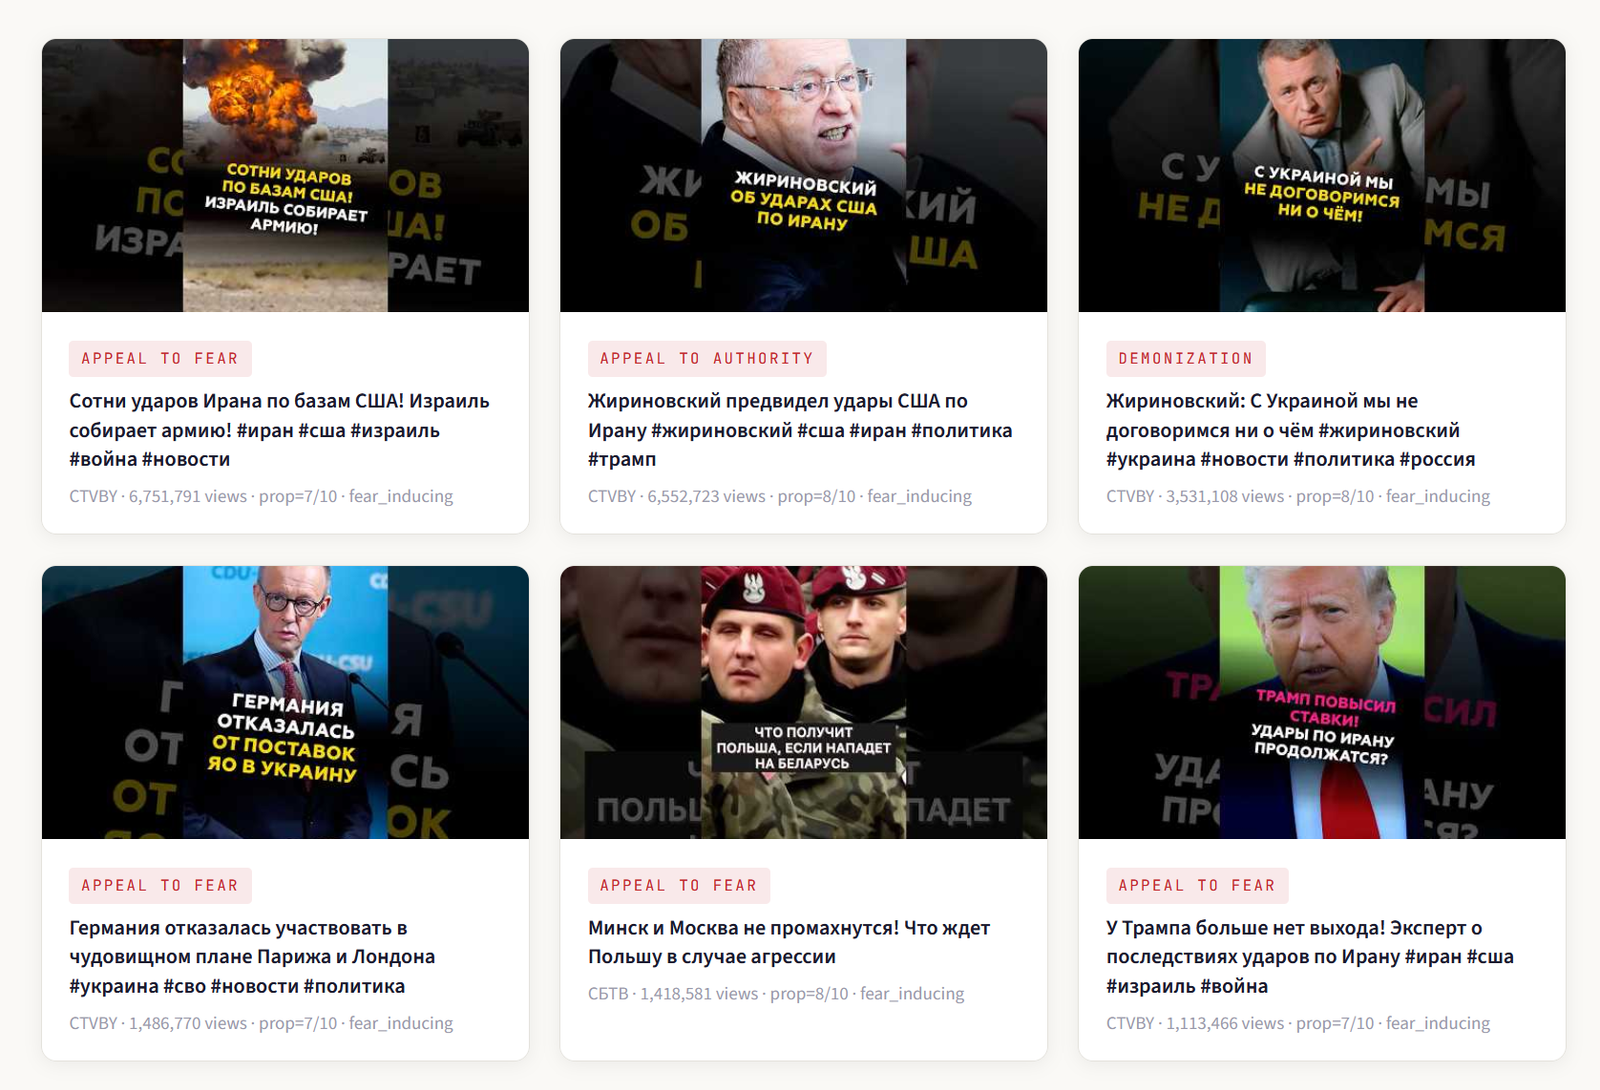
Examples: High-risk propaganda
Five channels, five roles
The analysis confirms that the five state-owned YouTube channels function not as independent editorial offices, but as elements of a unified system with distributed roles.
SBTVserves as the main anti-Western mouthpiece with the highest FIMI rating among all channels: 62.6%. The average propaganda score is 6.21 out of 10 (302 videos in February).
CTVBYSpecializes in fear-mongering. FIMI: 50.9%, average propaganda score: 5.40, 369 videos. This channel is home to videos with millions of views, whose titles are dominated by exclamation marks and threatening language.
NEWS.BYWorks as a hybrid: an anti-Western agenda combined with intimidation. FIMI: 48.5%, average propaganda score: 5.36, 237 videos.
BelTA News AgencyFocuses on the cult of personality and appeals to authority. FIMI is significantly lower: 31.3%, average propaganda score: 4.44, 351 videos. Lukashenko is mentioned in this channel’s transcripts more often than on any other.
ONT TV channelServes as a “showcase for objectivity.” It has the lowest clickbait score (2.23 out of 5) and the highest proportion of neutrality. FIMI: 41.9%, average propaganda score: 4.97, 344 videos.
Main propaganda techniques
Of the 1,603 transcripts analyzed, the most common techniques were “appeal to authority” (520 videos), “appeal to fear” (358), “emotional manipulation” (148), “card stacking” (133), and “demonization” (92). The “plain folk” technique was also recorded in 47 cases, while the “bandwagon” and “whataboutism” techniques were used in 29 and 28 cases, respectively.
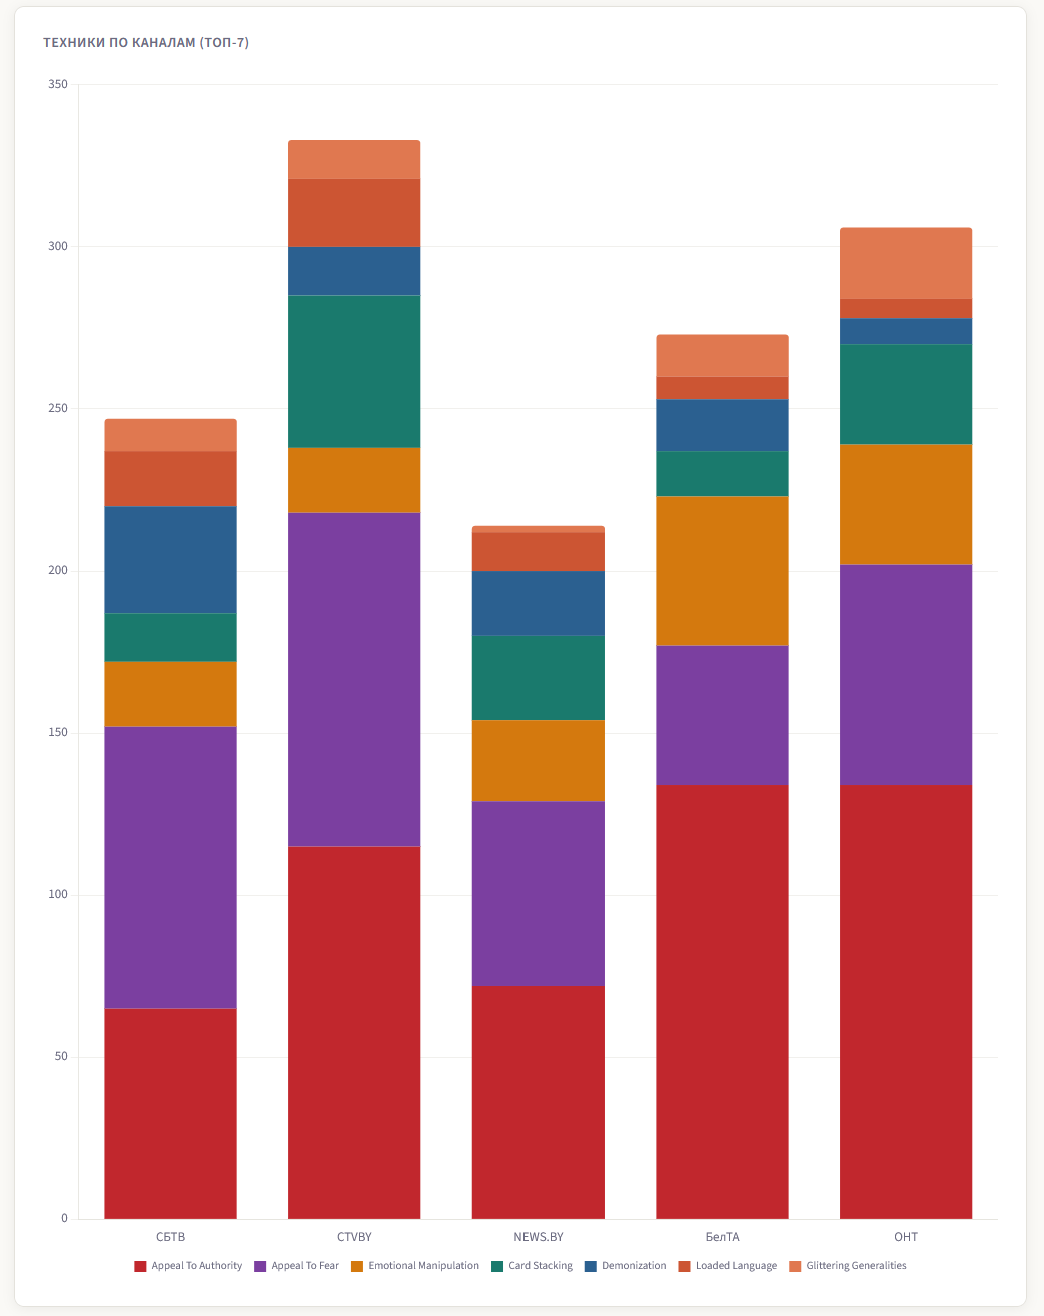
The distribution of techniques between the channels highlights the division of roles. CTVBY and SBTV lead in “appeal to fear” (103 and 87 videos, respectively), while BelTA and ONT focus on “appeal to authority” (134 videos each).
Geo-targeting: Who is being attacked?
An analysis of geographic references in February’s transcripts shows that the most frequently mentioned countries were Russia (552 mentions), the United States (495), Ukraine (424), the European Union (239), and Poland (222). They were followed by Germany (168), France and Lithuania (148 each), China (140), Iran (119), the United Kingdom (114), and Latvia (93).
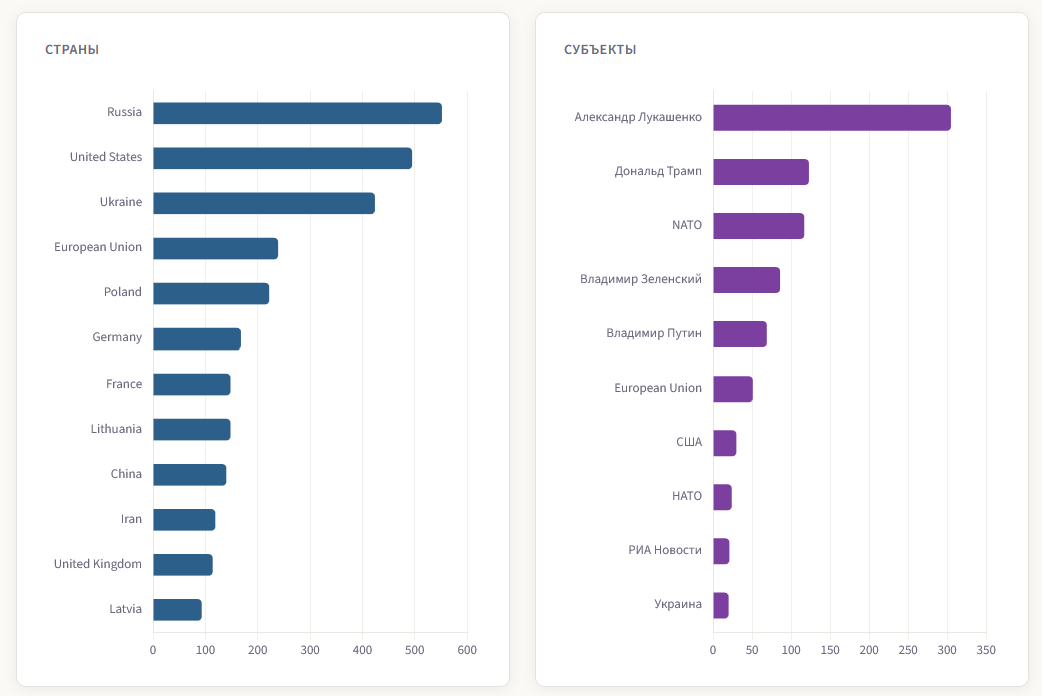
Among individuals and organizations, Alexander Lukashenko leads the way (305 mentions), followed by Donald Trump (123), NATO (117), Volodymyr Zelensky (86), and Vladimir Putin (69). The high frequency of mentions of Trump and Iran in February is explained by the context of the American strikes on Iran, which were actively used to promote narratives of Western aggression and the instability of the world order.
Emotional Strategy: Fear as a Tool
The most common emotional tone in February was “fear-inducing,” recorded in 536 transcripts. The second most common was “positive” (252), followed by “patriotic” (230), “neutral” (197), and “contemptuous” (210). The ratio of negative emotional tones (intimidation, aggression, contempt, negativity) to positive ones (positive, patriotic, triumphal) was approximately 2:1.
Interestingly, different channels operate in different emotional registers. SBTV and CTVBY generate predominantly intimidating content (111 and 165 videos), while BelTA and ONT more often use a positive and patriotic tone.
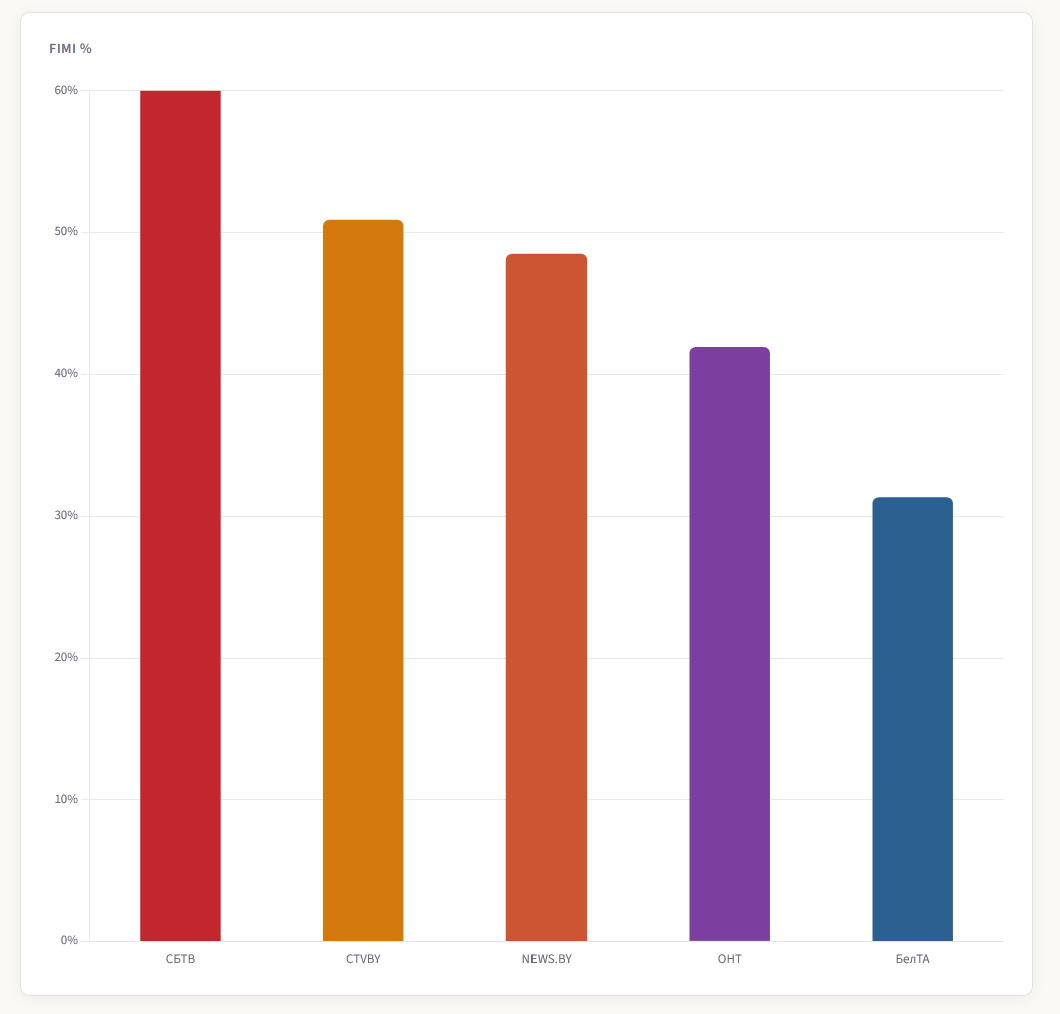
FIMI: 46.5% of content shows signs of foreign information manipulation
The share of videos with FIMI indicators in February was 46.5%, up from 41.3% in January. The variation between channels is significant: from 62.6% for SBTV to 31.3% for BelTA. This means that almost every second transcript contains elements that, according to the EEAS methodology, qualify as intentional and coordinated manipulation of the information environment.
Risk level: 11.7% of all analyzed videos were rated “high risk,” and 5 videos were classified as “critical.” The highest-risk videos were primarily from SBTV (54 videos) and CTVBY (30 videos).
Visual Analysis: Clickbait and Misalignment
In parallel with the transcript analysis, we conducted a visual analysis of 1,699 February covers using Vision LLM. The average clickbait value across all channels was 2.9 out of 5. CTVBY had the highest clickbait value (3.33), while ONT had the lowest (2.23).
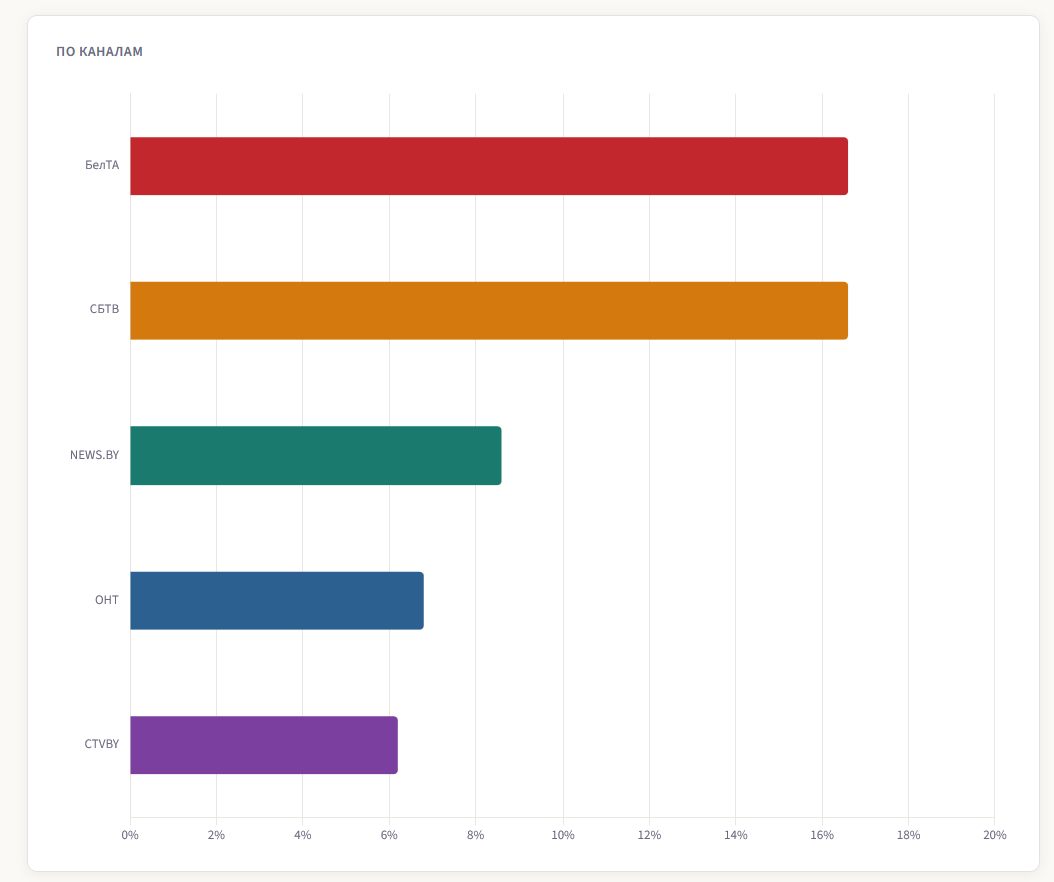 A separate indicator: the discrepancy between the title text and the visual content of the cover. In 11% of cases, the image and the title convey significantly different messages. BelTA and SBTV led the discrepancy (16.6% each), indicating the intentional creation of clickable covers that do not necessarily correspond to the content of the video.
A comparison of digital cover prints (a technology that allows for the detection of visually identical images) revealed a production line: 7.1% of SBTV covers are visual duplicates, indicating the use of templates for serial program releases.
What works better: propaganda and views
An analysis of the correlation between the type of propaganda technique and median views revealed an unexpected result: the “plain folk” technique garners the highest median views (147,458), significantly outpacing all other categories. “Loaded language” ranks second (29,637), followed by “scapegoating” (23,035), and “demonization” (20,508).
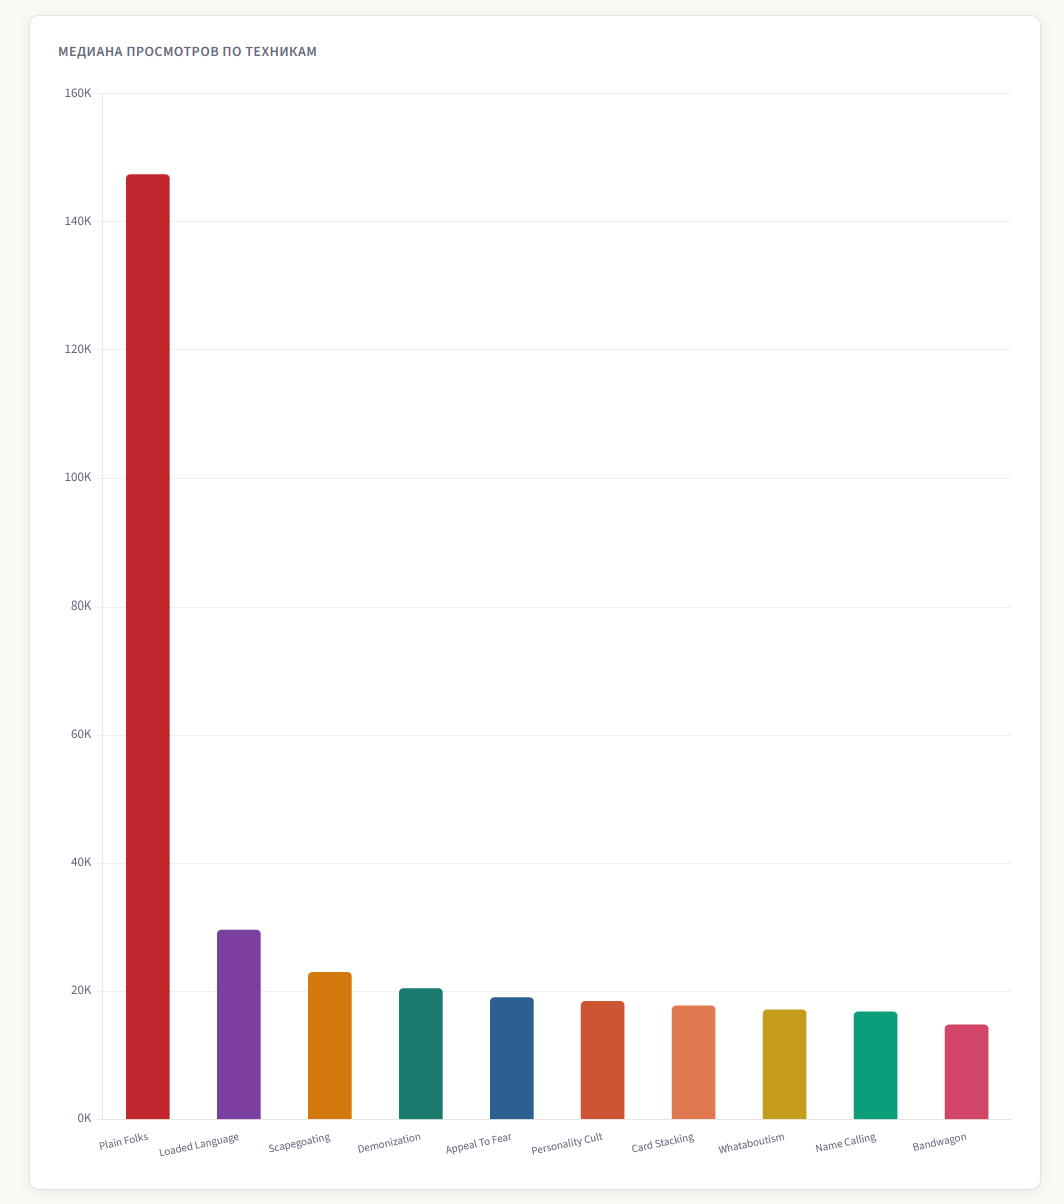 This is an important conclusion: the most effective propaganda strategy on YouTube turned out to be not one that intimidates or demonizes, but one that creates the image of a “people’s leader” who is relatable and understandable to viewers.
Technology: How the analysis works
This study is based on a multimodal RAG (Retrieval-Augmented Generation) system built on PostgreSQL with the pgvector extension for semantic search. At the time of publication, the database contains over 34,000 videos with full transcripts, metadata, and analytical annotations.
The analysis pipeline includes several stages. First, transcripts are extracted from the database and run through GPT-5-mini using a structured prompt (codebook v3.0), which classifies each video according to 20 propaganda techniques, 10 narrative categories, 8 types of emotional tone, geographic targeting, and FIMI indicators. Concurrently, the covers are analyzed by a separate Vision LLM pipeline (codebook v2.0), which evaluates visual elements of propaganda, clickbait factors, and cross-modal correspondence between the title text and the image.
The results from both pipelines are stored in linked tables, allowing for the formulation of analytical queries across modalities: for example, “which visual framing strategies correlate with the highest levels of misinformation in transcripts.” The final interactive reports, with 17 graphs and a glossary of terms, are automatically generated by a single command for any month.
Comparison: January and February
| Indicator | January 2026 | February 2026 |
|---|---|---|
| The video has been analyzed. | 908 | 1,603 |
| Average propaganda score | 5.09/10 | 5.24/10 |
| FIMI share | 41.3% | 46.5% |
| High risk share | 10% | 11.7% |
| Visual objects (covers) | 965 | 1,699 |
The increase in FIMI’s share from 41.3% to 46.5% can be explained by the geopolitical context of February 2026, in particular the active coverage of US military action against Iran, which was used to promote anti-Western narratives.
Conclusions
The February analysis confirms the persistence of the patterns identified in January and simultaneously reveals an increase in propaganda efforts. Five state-run channels continue to function as a unified system with a clear division of roles: from fear-mongering (SBTV, CTVBY) to constructing an “objective” image (ONT). Almost every second analyzed transcript contains FIMI indicators in the European Union’s terminology.
With each month, a data set accumulates, allowing us to track not only current trends but also long-term shifts in propaganda strategies. The full interactive report with 17 charts is available at this link, and a glossary of terms explains each of the categories used in the analysis, with examples of real videos from the database.
Links.
Interactive report:publication_2026-02_en.html
Glossary:glossary_2026-02_ru.html
January publication:publication_jan2026_ru.html
EEAS about FIMI:eeas.europa.eu