

We collected and machine-processed Belstat’s public archive, extracting 5,855,984 observations. We also verified 915 indicators from the agency’s interactive data portal. The conclusion reached by three independent lines of verification is surprising for a country with a reputation for pervasive propaganda:The current government isn’t so much falsifying figures as it is selectively suppressing those layers of statistics that can be verified from the outside.
Thus, the “Public Finance” and “Energy” sections disappeared from the pocket statistical reference book after 2022. On the data portal, 106 out of 915 indicators are frozen, and almost half of these freezes occur for 2020–2022. Moreover, with a few exceptions, indicators in kind: tons, kilowatt-hours, capacity utilization rate, physical export and import volumes. Value indicators in rubles and dollars continue to be published. The difference is fundamental: monetary volumes can be adjusted for inflation and interpreted using an adjusted methodology, while tons and kilowatt-hours are reconciled with the statistics of partner countries.
At the same time, we discovered a persistent practice of publishing understated preliminary figures for the current year and revising them a year or two later, showing growth. This was tested using the most high-profile example—the number of doctors, where the revision revealed an error in our own initial hypothesis. This is covered in a separate chapter, explaining why the method can still be trusted. And in some cases, the data that a country had stopped publishing was reconstructed from data from its trading partners.
1. What and how we countedOfficial Belarusian statistics are published in three formats, which are usually considered separately. We’ve combined them.
Printed publications.The Belstat publication catalog contains 988 accessible publications: 258 statistical digests, 676 bulletins, and 54 booklets. We downloaded them in full, unzipped them (68% of the publications are available as zip or rar archives, with the PDFs divided into chapters), and extracted machine-readable tables from them: 5,855,984 observations, each with publication, page, units of measurement, and footnotes.
Dataportal(dataportal.belstat.gov.by), an interactive system for disseminating official statistics with an open API. The key finding here is methodological: for each indicator, the portal publishes a “next publication date” field. If this date is in the past, the series is frozen, and we know from what point. This allowed us to construct a map of the relevance of official statistics: 915 indicators with a date accuracy down to the day.
International reporting.Belarus submits some of its indicators to UN systems (specifically, the UNECE Shared Environmental Information System). We used this data as a control group.
We applied three manipulation detectors to printed publications, based on a comparison of publications within the same series:retrospective edits(the same figure for the same year, but different in different years’ editions)disappearances(an indicator or an entire section was and is no longer there) andtracking footnotes (methodological caveats that change the scope of the data).
We’d like to highlight what was an unexpected result of the work itself. Of the 5.9 million observations extracted, only2.4% were in normally marked, machine-readable tablesThe rest had to be restored by reconstructing the typographic layout: 72% using the text grid, 25% using the coordinates of individual words on the page, since the tables in the old collections have neither lines nor structure, and the columns are aligned with spaces. The data is formally open, but not usable. This is a separate topic, and we will return to it at the end.
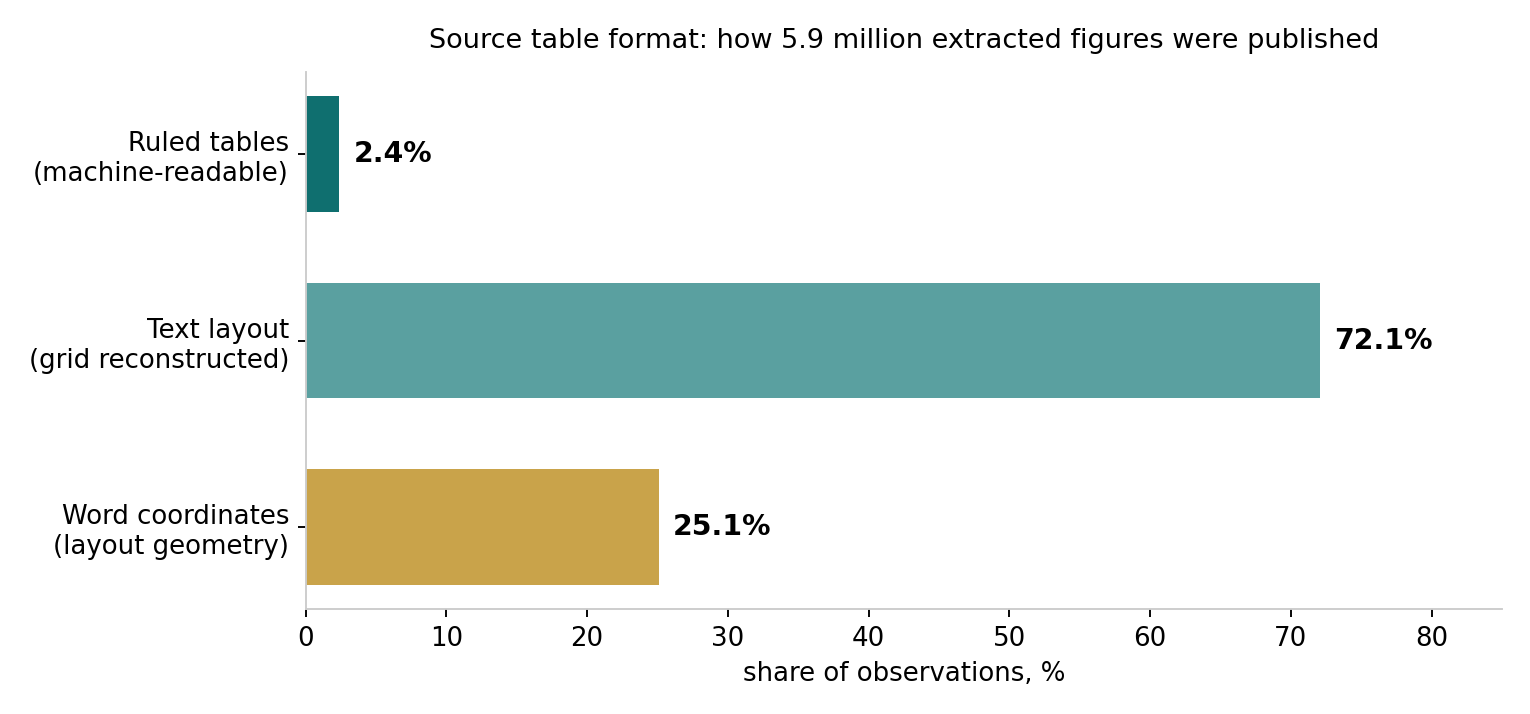
Fig. 1.Source table format: how the 5.9 million extracted indicators were published.Source: FactCheck.LT calculations according to archive of Belstat publications.
2. Disappearing sectionsThe most obvious sign that a topic is being abandoned is the disappearance of an entire section from the annual reference book.
The “Belarus in Figures” collection is published annually and provides a condensed overview of the country’s socioeconomic situation: approximately sixty pages, divided into two dozen sections. We compared thirteen editions, from 2014 to 2026, and arrived at the following picture.
Public Finances— revenues and expenditures of the consolidated budget, its deficit, and the structure of expenditures by area — were published continuously from 2014 to 2022. Starting with the 2023 edition, this section is no longer included in the reference book.
Energy— Electricity production by plant type and energy balance — appeared in the 2021 and 2022 editions and disappeared from the 2023 edition.
Social Securitywas present in the 2019–2021 editions and disappeared from the 2022 edition.
There is also a reverse movement, and it is indicative. Section “Offenses”In the reference book, on the contrary, they added it, starting with the 2020 edition. Registered crime in Belarus is falling (from 88,500 cases in 2022 to 63,900 in 2025), and the authorities are eager to highlight this dynamic. The logic of the selection is obvious: what flatters is added; what exposes is removed.
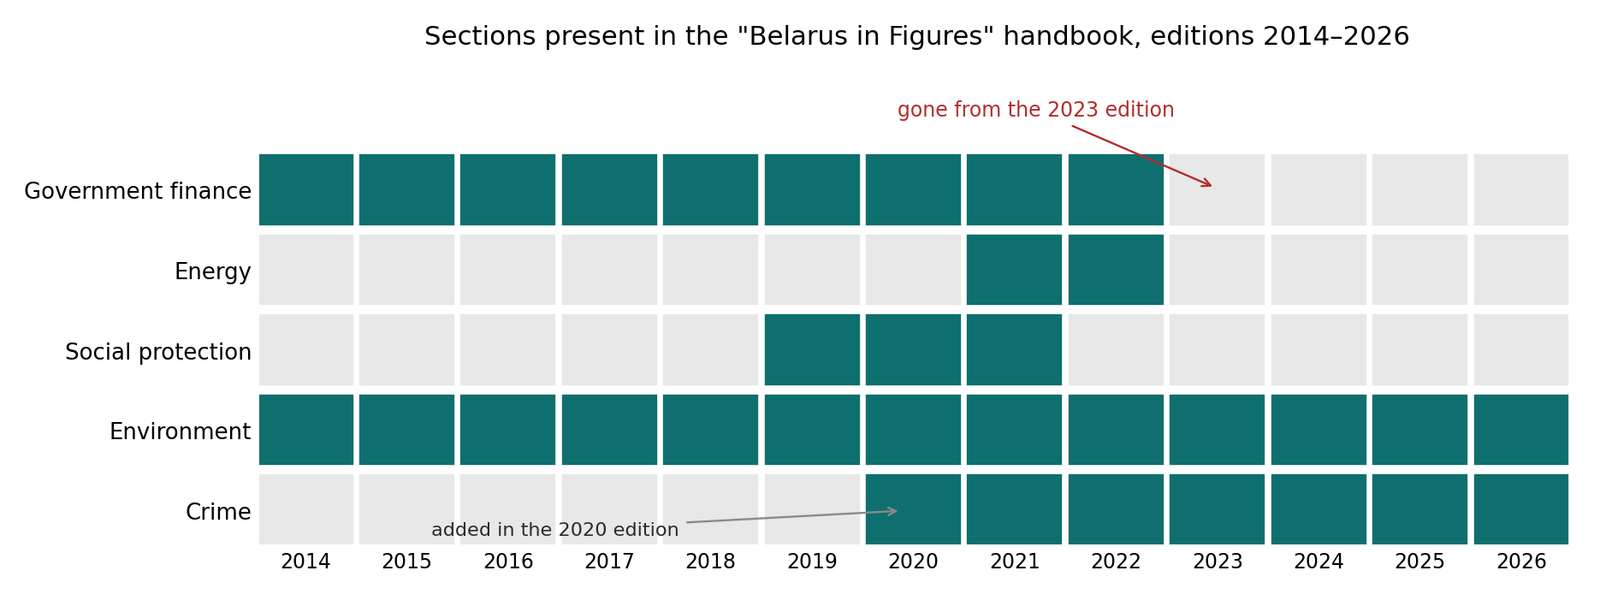
Fig. 2.Presence of sections in the reference book “Belarus in Figures”, 2014–2026 editions.Source: 13 editions of the reference book.
An important caveat. Disappearance from the pocket reference book does not equate to complete classification: thematic subsections on the Belstat website in some cases continue to exist. But the reference book is the publication by which journalists, diplomats, and analysts judge the state of the country, and it was from this reference book that the budget and energy sector were removed in 2023, that is, after the start of a full-scale war, waves of sanctions, and increased military spending.
3. Retroactive edits: always in one directionComparison of the same figures in different publications. Statistical agencies around the world revise their data, and this is normal practice; Belstat even publishes its own revision policy. What’s abnormal is the systematic direction of revisions and their increasing magnitude. Across thirteen editions of the handbook, we found 2,096 retrospective revisions. Here’s what they show.
Fixed capital investment—the government’s main “target” indicator—is being revised upward, and the magnitude of the revision is growing.For 2023, the initial estimate of 35.7 billion rubles was revised up to 37.4 billion (+4.5%). For 2024: 44.4 → 47.3 billion (+6.1%). In previous years, the revision rate was around 2.5–3.5%. Gross domestic product for 2024 was also revised up: 246.6 → 255.1 billion rubles (+3.4%). Industry for 2024: up 2.9%.
Deteriorations, on the contrary, are clarified downwards.The balance of foreign trade in goods and services for 2023 has been revised from $0.5 to $0.2 billion, and for 2024 from -$1.3 to -$1.5 billion.
The asymmetry is also evident across sections. Among significant revisions (more than 1%), 80% were upward revisions in healthcare, 69% in investments, and 68% in foreign trade. And in the “Finance” section, while it was still being published, nothing was revised upwards: budget indicators have been changing exclusively for the worse.
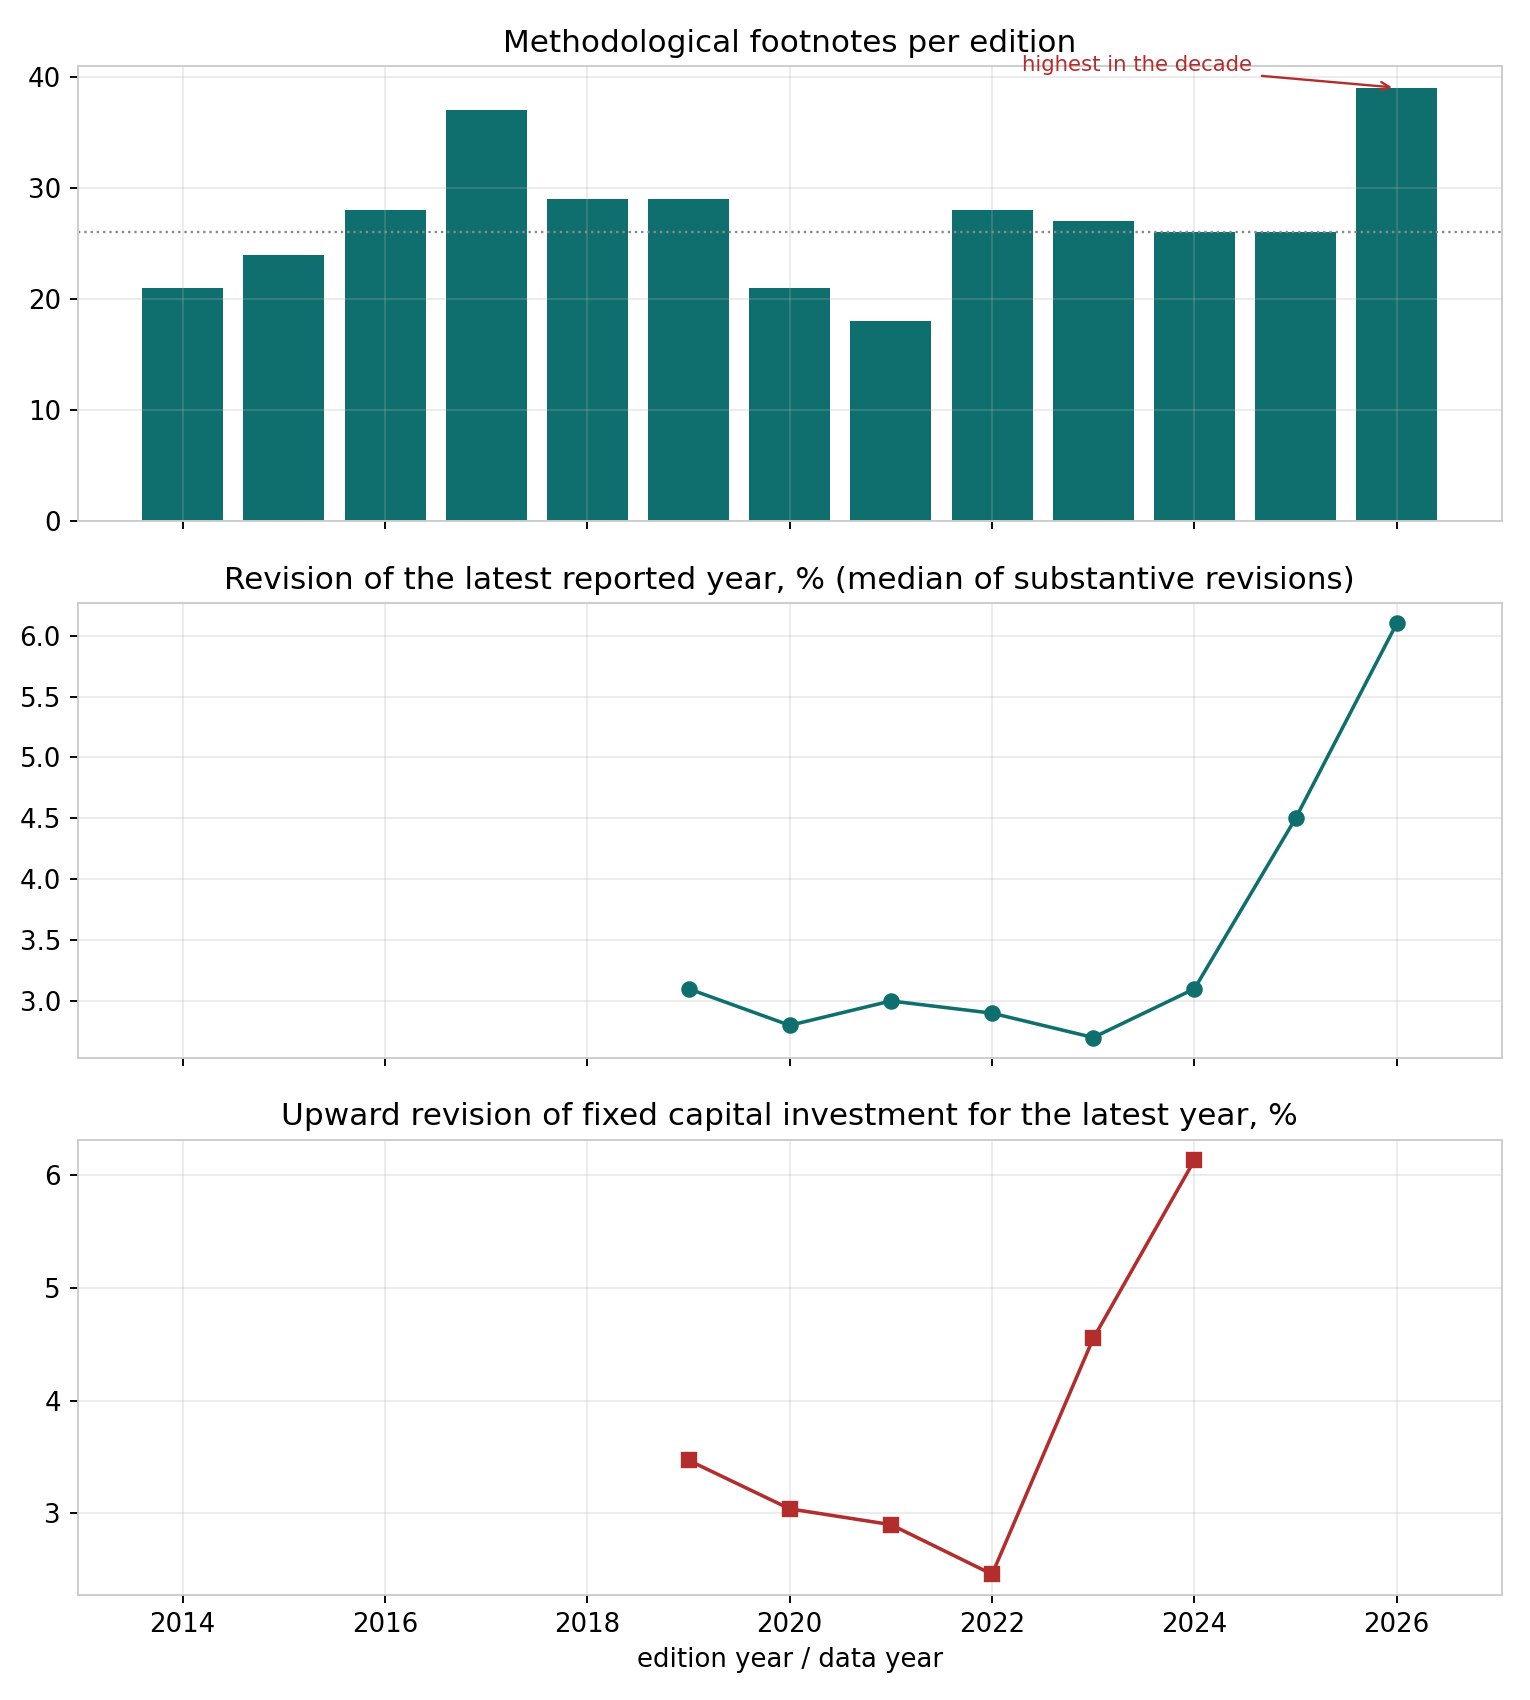
Fig. 3.Methodological footnotes and the extent of retrospective revisions by publication.Source: calculations FactCheck.LT.
FootnotesA methodological caveat in a footnote changes the scope of an indicator, thus breaking the comparability of the series. This usually occurs when indicators deteriorate. In the 2026 edition, we discovered 39 footnotes versus a decade median of 26— the highest for the entire observed period. Among the new ones: the average salary for 2025 was calculated excluding organizations with an average headcount of fewer than 50 employees (this inflates the result); healthcare data for 2025 are provided “according to the Ministry of Health system” (i.e., for a narrowed range of institutions); a similar narrowing is for culture; in telecommunications, the threshold for retained earnings has been raised from 15 to 49 employees. Five changes in coverage in one publication in the absence of new footnotes in the previous year’s edition.
4. Dataportal: Two darkness modesBelstat’s data portal is a modern system with a software interface, and it is this that has made it possible to quantify obscurity. Each indicator is accompanied by a promised date for the next publication; an expired date is a formal, recorded acknowledgement by the agency itself that the series is not being updated.
Of 915 unique indicators106 (12%) have not been updated for more than a yearAnd the distribution of these frosts by year falls into two distinct patterns.
1. Departmental entropy.About twenty indicators froze between 2008 and 2011: the number of residential phones, pine tapping, and seed exports. These are dead metrics, abandoned long before any policy was introduced. For our study, they serve as a control group, as they demonstrate that the method distinguishes between negligence and intent.
2. Political cluster.Fifty indicators (47% of all frosts) occur between 2020 and 2022. Here’s their breakdown:
- export and importin kind:The promised publication is scheduled for August 2021, two months after the introduction of EU sectoral sanctions;
- Indices of physical volume and price terms of foreign trade – July 2022;
- production of industrial productsin kind expressedand the capacity utilization rate – June 2022;
- cargo transportation volumes – 2022;
- production of electric and thermal energy – July 2020;
- wholesale trade in physical terms – April 2022;
- Innovation expenditure and share of innovative products – May 2021.
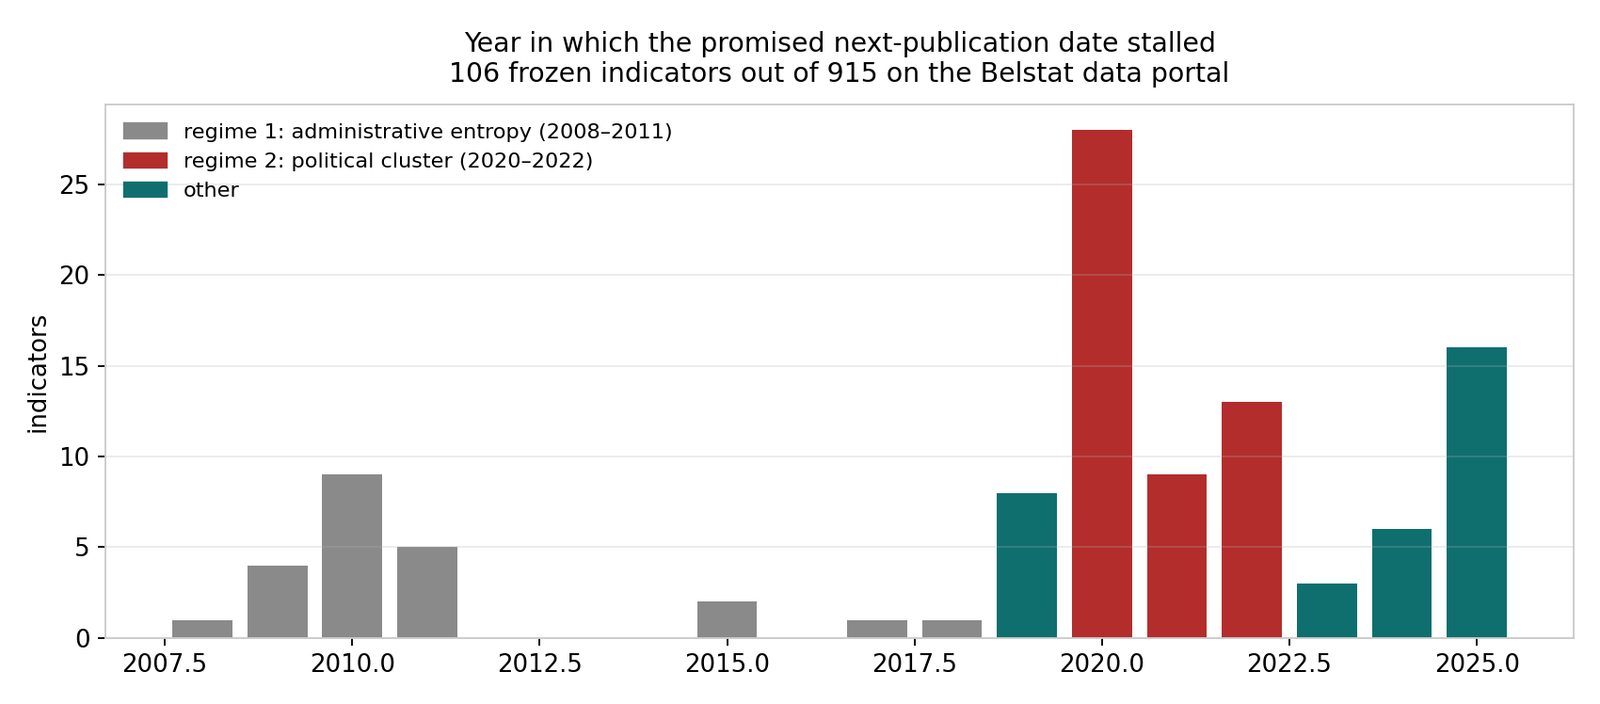
Fig. 4.The year at which the next publication date stopped: 106 frozen dataportal indicators out of 915. Source: dataportal.belstat.gov.by, field nextPublicationDate.
The pattern can be summed up in one sentence:Physical indicators are frozen, but cost indicators continue to be published.This choice makes perfect sense. Ruble production volumes grow along with inflation and are almost impossible to verify externally. Tons, units, and kilowatt-hours don’t grow on their own, and, most importantly, they are verified against mirror statistics: customs data from partner countries, reports from energy operators, and UN databases. They closed down precisely what was verifiable.
The elegance of the energy case deserves special mention. Of the portal’s energy indicators, the physical series are frozen, while only three are updated: GDP energy intensity, energy efficiency, and the share of renewable sources in electricity generation. All three are Sustainable Development Goal indicators, meaning they are internationally reported. And all three are relative quantitiesYou can report for years that energy intensity is declining without disclosing how much energy has been produced or the power output of the plants. Coefficients without levels.
A disclaimer: some of the social indicators frozen in 2019–2020 (breastfeeding prevalence, iodized salt consumption) are indicators from the MICS sample survey, and their freezing may indicate a lack of a new round of surveys, rather than a concealment. We do not classify them as part of the political cluster.
5. International Circuit: The First to Go SilentThe energy indicators that Belarus publishes within the UNECE Shared Environmental Information System (SEIS) on the Belstat website only contain data up to 2019–2020.
This happened before the internal frameworks froze. The sequence is as follows: first, they stopped updating comparable reporting for international systems, then they included the “parade” section “Energy” in the internal reference book for two years, and then they removed it too.
6. Anatomy of a Blackout: Energy and Nuclear Power PlantsWe fully analyzed the energy situation because it constituted all three types of manipulation, revealing a motive. And most importantly, we were able to reconstruct data from other countries that we had stopped publishing.
Step one, 2018.The latest edition of the collection “Energy Balance of the Republic of Belarus” is missing the chapter “Belarus and Countries of the World”—international comparisons that were included in the 2017 edition. Comparisons with the EU, the US, and neighboring countries are the first to be removed.
Step two.After the 2018 issue, which contains data up to and including 2017, the “Energy Balance” series will be discontinued.
Step three, 2019–2020.International SEIS reporting is suspended. In July 2020, the data portal’s physical series were frozen: electricity and heat production, power plant capacity (the most recent since 2019), and fuel consumption by organizations (since 2018).
Step four, 2021–2022.The pocket guide now features an “Energy” section—a showcase of the Belarusian Nuclear Power Plant. The first power unit was put into commercial operation in June 2021, and a structural shift in the data is visible: total electricity generation in 2021 increased to 40,583 million kWh, while thermal power plant generation fell from 37,591 to 34,374 million kWh. This difference of approximately 5.8 billion kWh represents the nuclear power plant’s contribution.
Step five, 2023.The “Energy” section disappears from the reference book several months before the second nuclear power plant unit was commissioned (November 2023). The showcase was closed before the second source of pride.
What did the last published balance show?Table “Imports and Exports of Electric Energy” from the 2018 edition (millions of kilowatt-hours):
| 2010 | 2013 | 2014 | 2015 | 2016 | 2017 | |
|---|---|---|---|---|---|---|
| Imports – total | 2,971 | 6,716 | 3,826 | 2,816 | 3 181 | 2,733 |
| from it: Russia | 30 | 3,597 | 1,425 | 2,815 | 3 181 | 2,733 |
| from it: Ukraine | 2,941 | 3,004 | 2,401 | 1 | – | – |
| Export – total | 271 | 346 | 508 | 194 | 160 | 148 |
| from it: Lithuania | 270 | 327 | 502 | 190 | 155 | 147 |
The first thing that catches your eye:Belarus was a net importer of electricity.In 2017, the country imported 2,733 million kWh and exported 148 million—eighteen times less. Supplier substitution is also evident: the Ukrainian electricity grid, which provided almost three terawatt-hours in 2010–2014, was completely replaced by the Russian one in 2016.
This clarifies the purpose of the nuclear power plant. The Belarusian NPP made economic sense primarily asimport substitution: two power units with a design output of approximately 14 billion kWh per year cover the entire previous import (2.7 billion) with a fivefold reserve. The question that follows is where to put this reserve.
What happened next—and what official statistics didn’t showPublication of balance sheets ceased with 2017 data. Anything that has happened to Belarusian electricity exports since then is reconstructed only from mirror statistics—UN Comtrade data on international trade (UN Comtrade, commodity item 2716), where both parties to the transaction report independently.
| Export to Lithuania, million kWh | 2017 | 2018 | 2019 | 2020 | 2021 | 2022 |
|---|---|---|---|---|---|---|
| according to Belarus | 147¹ | 1,035 | 1,509 | 497 | — | — |
| according to Lithuanian data | — | 1,011 | 863 | 497 | 0 | 0 |
¹ Belstat energy balance data; hereinafter referred to as UN Comtrade.
The picture turned out to be the opposite of what the ragged official row suggested.Exports did not die – they grew.From 147 million kWh in 2017, supplies to Lithuania increased sevenfold in one year and peaked at 1.5 billion kWh in 2019, just before the nuclear power plant’s launch. This was followed by a halving in 2020 and a complete zero starting in 2021: Lithuania legally closed commercial electricity flows from Belarus due to the launch of the Astravets nuclear power plant.
The reliability of this data is verified by the fact that both sides report the same figures: for 2020, Belarus reported exports of 497,014 thousand kWh, while Lithuania reported imports of 497,090 thousand kWh. The discrepancy is 0.015%. (For 2019, the discrepancy is significantly greater—1,509 versus 863 million; such discrepancies in mirror statistics are usually explained by different interpretations of the country of origin during transit and require separate analysis.)
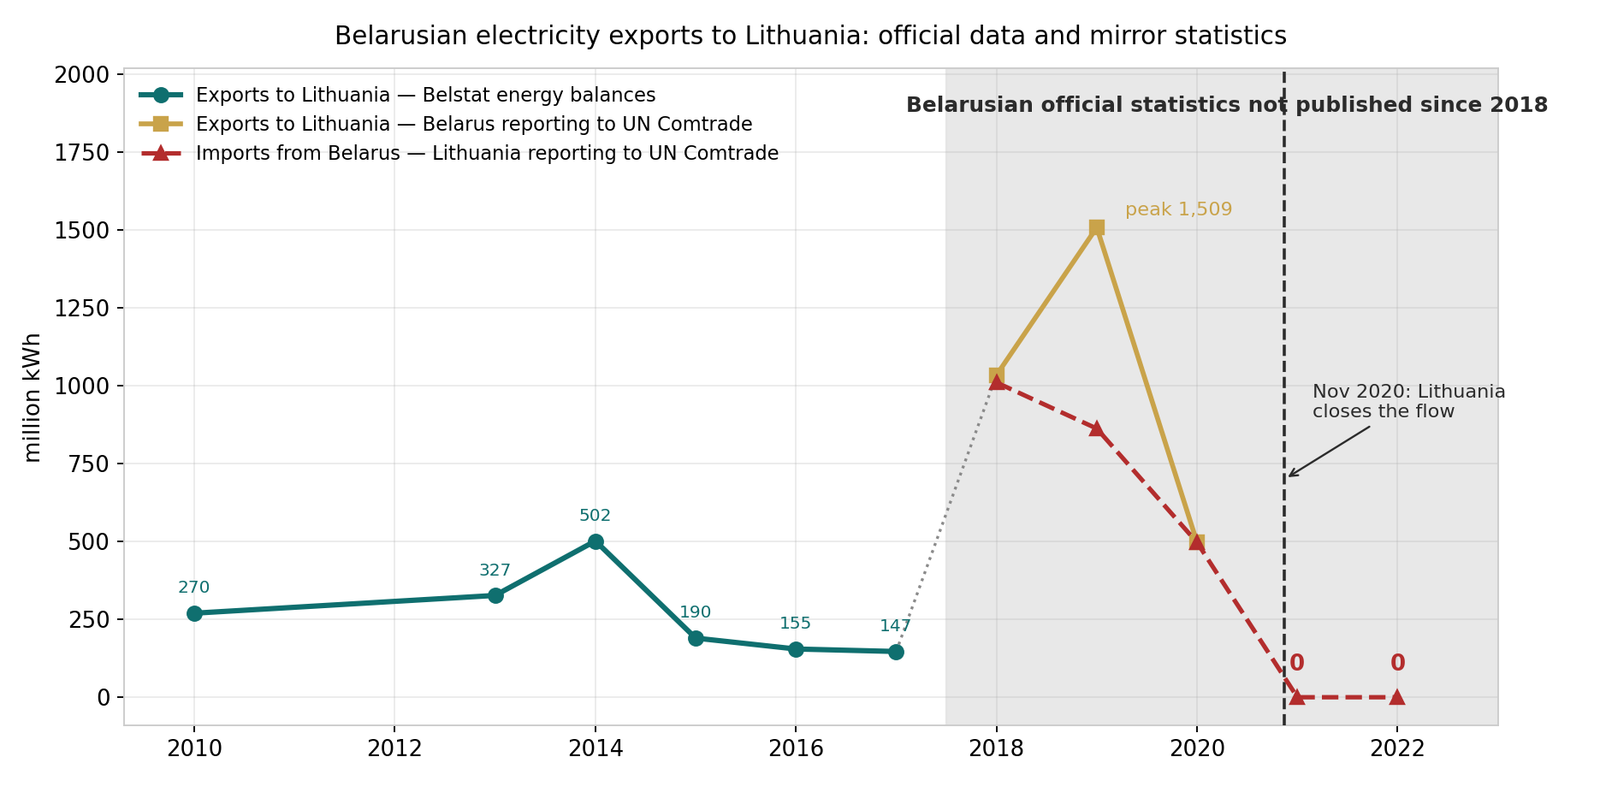
Fig. 5.Electricity exports from Belarus to Lithuania: official data and mirror statistics.Sources: “Energy Balance of the Republic of Belarus, 2018,” p. 62; UN Comtrade, item 2716.
What does this mean?The entire key episode—the rapid growth of exports in 2018–2019 and their zeroing in 2021—occurred entirely during a period when Belarus no longer published energy balances. National statistics show neither ups nor downs. If one relies solely on official Belarusian sources, the last thing one can know about Belarusian electricity exports is the 2017 figure, after which silence ensues.
Meanwhile, the scale of the comparison speaks for itself. Even the peak of 1.5 billion kWh in 2019 is about a fifth of the annual output of one power unit of the Belarusian Nuclear Power Plant. The export market, such as it was, could not utilize the plant’s capacity; and after the Lithuanian ban, it disappeared altogether. Publishing the balance further would mean showing this in figures.
Tariff lineThe electricity tariff for households (basic, with a gas stove) increased from 0.2092 rubles per kWh in 2021 to approximately 0.2790 rubles in 2025— a nominal increase of 33.4%, with cumulative inflation over the same years at approximately 36.6%. This means that the tariff has not increased in real terms: the promised “atomic” price reduction did not occur, but households also failed to make payments on their Russian loan. The loan was repeatedly restructured, and the repayment date was postponed. And in March 2026, the tariff increased one-time to 0.3265 rubles (an increase of 17%, with annual inflation at approximately 7%), representing the first real increase of approximately 10% after four years of freezing. The official explanation: bringing costs to “economically justified” levels, the declared range for which for 2026 is 0.25–0.35 rubles per kWh.
It’s impossible to verify the plant’s profitability using publicly available data. The burden of the loan should be evident in Belenergo’s losses and debt, in budgetary energy subsidies, and in tariffs for legal entities. This is precisely the data that was removed from publication along with the “Public Finances” section after 2022.
7. The Anatomy of One Indicator: The “Doctor Collapse” That Never Happened
Raw signal.According to the “Belarus in Figures” reference book, the number of practicing physicians in 2024 was 49,100, and in 2025, 42,200. A 14% decrease over the year. At the same time, the number of mid-level medical personnel decreased by 13,500, and the number of doctor visits fell from 123.7 to 108.4 million. Against the backdrop of the well-known exodus of medical professionals from the country after 2020, this was seen as a health care system catastrophe.
What the revision detector showed.A comparison of publications revealed a consistent practice: new healthcare data is systematically published for a narrow range of institutions and revised upwards every year or two. For 2018: 38.6 → 42.5 thousand. For 2019: 38.8 → 42.9 thousand. For 2021: 41.7 → 48.1 thousand. For 2023:41.3 → 48.7 thousand (+17.9%) — without any footnote at the time of first publication.
Verifiable forecast.If this is the same mechanism, the figure of 42.2 for 2025 should be revised to approximately 49–50 thousand.
Examination.The data portal eliminated the need to wait for the next compilation: the “Number of Practicing Physicians” indicator has a “Type of Organization” dimension with two values: “Total” and “Organizations of the Ministry of Health System.” Official data for 2025:
| Year | 2021 | 2022 | 2023 | 2024 | 2025 |
|---|---|---|---|---|---|
| All practicing physicians | 48 134 | 47,999 | 48,713 | 49 102 | 50 712 |
| Ministry of Health system | 41,700 | 41 168 | 41 256 | 41,467 | 42,240 |
| Outside the Ministry of Health system | 6,434 | 6,831 | 7,457 | 7,635 | 8,472 |
No collapse.2025 – a record year: 50,712 doctors, with the annual increase being the largest in five years. The figure 42,200 from the reference book is the lowest, second only to the Ministry of Health’s system (42,240 on the portal). The “collapse” occurred solely because two different coverages were merged into one reference book table. The 2026 edition included an explanation in a footnote for the first time; the 2024 and 2025 editions made the same merger without explanation.
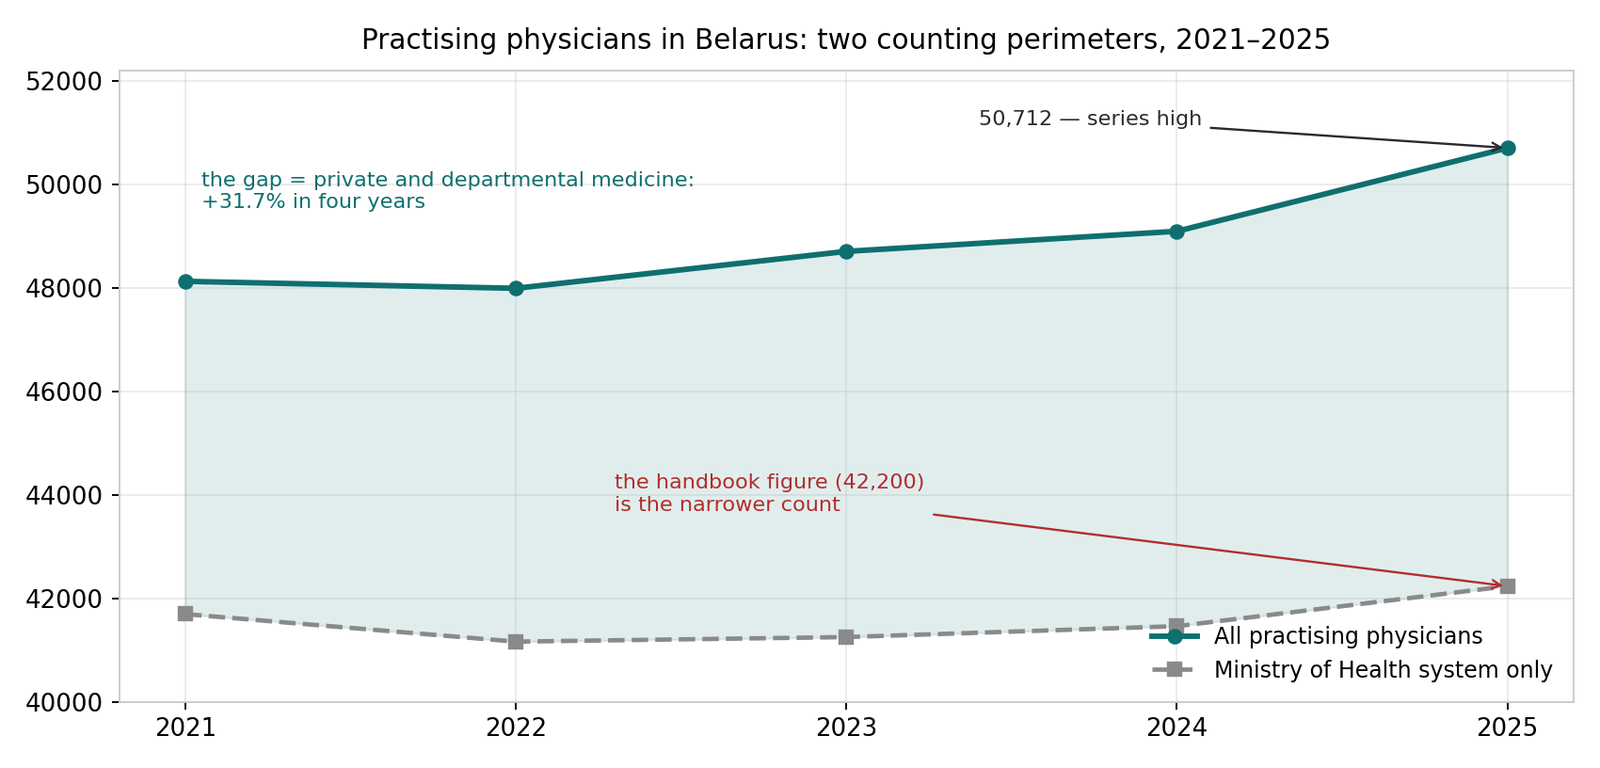
Fig. 6.Number of practicing physicians: two accounting systems, 2021–2025.Source: Belstat data portal, indicator 10104000001.
But there is a real signal in this data, and it is more important than the apparent one.The country’s entire growth in the medical corps comes from outside the public system: over four years, the number of doctors outside the Ministry of Health system increased from 6,434 to 8,472 (+31.7%), and their share increased from 13.4% to 16.7%. The public sector, meanwhile, grew slightly—by 1.3%. Geographically speaking, from 2021 to 2025, Minsk posted a 9.7% increase, the Minsk Region a 10.1% increase, the Vitebsk Region a 0.6% increase, and the Mogilev Region a 2.3%. Doctors are moving from the regions to the capital’s metropolitan area and from the public sector to the private sector, while the overall number of specialists is officially growing.
Let’s measure the motive for the flow.The average salary in healthcare relative to the national average: 76% in 2017–2018, a jump to 88.6% in 2021 (COVID-related surcharges), and a downward slide to79.6% in 2025Medical workers’ salaries are four-fifths of the national average.
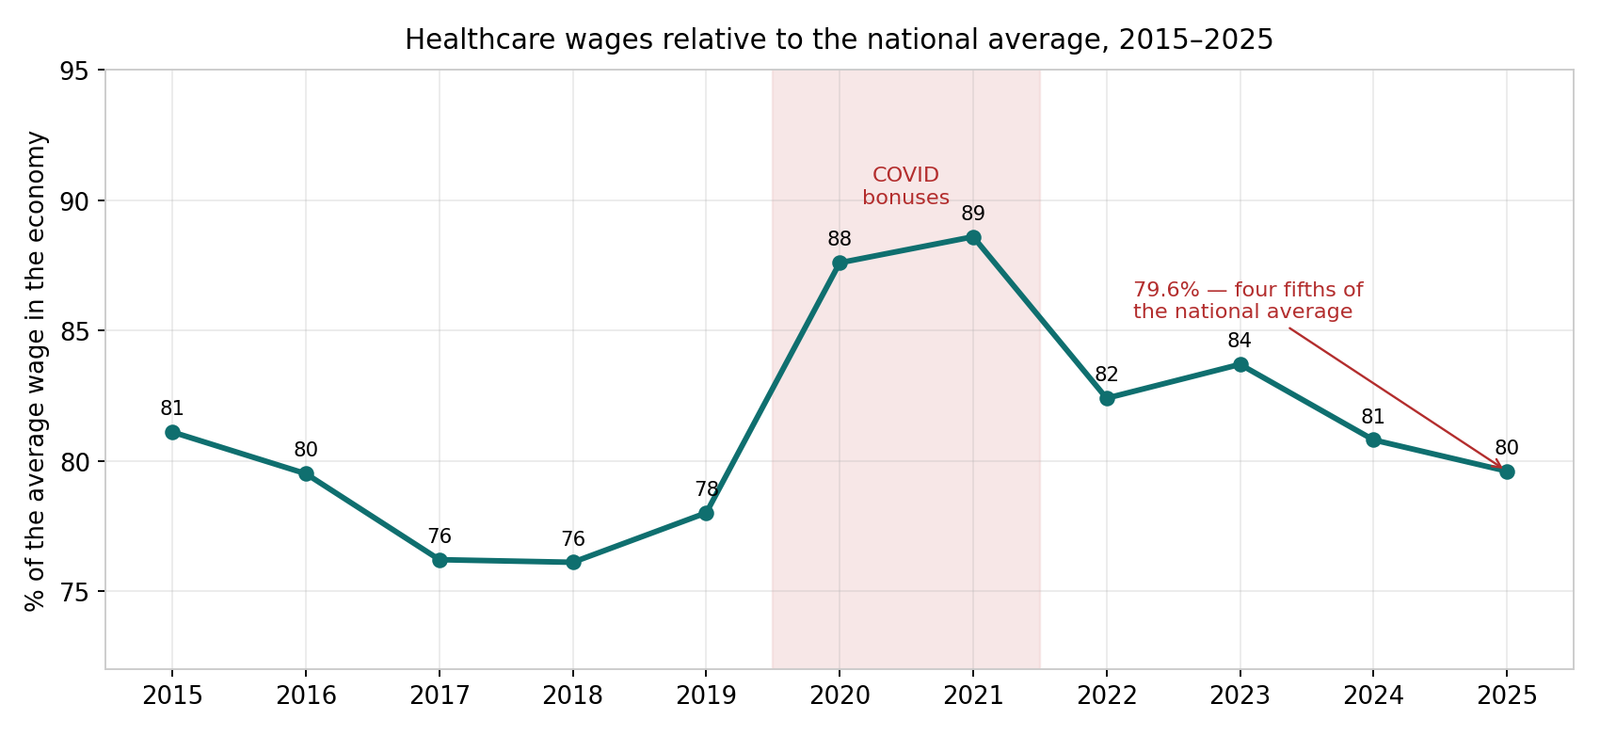
Fig. 7.Healthcare Salaries Compared to the Economy’s Average, 2015–2025.Source: “Labor Cost” section of Belstat reference books.
And here we hit a wall.It is known that doctors at state institutions often work part-time in private clinics. If organizations report their staffing figures independently, one doctor may be included in the statistics twice, and then part of the “private sector growth” is an accounting effect, not actual personnel. It is impossible to verify this using Belstat data.In 988 publications and twenty years, we haven’t found a single line about medical workers holding more than one job.Moreover, for teachers, this breakdown is published systematically (“without part-time workers” as a separate column), for researchers, it is published, and for small businesses, it is published. The methodology is capable of counting part-time workers. It is not applied to medical professionals.
A cautious formulation, which we believe is the only correct one: the growth of the medical corps is entirely due to the non-governmental sector. Given the 20% salary gap and the widespread practice of holding multiple jobs, some of this growth could be an accounting effect, but it is impossible to verify this using official statistics, because Belstat does not provide such a breakdown for medical professionals, unlike for teachers and scientists.
8. Open data that cannot be usedSeparately, it is necessary to mention the technical state and the result of this work—Belarusian statistics as an infrastructure.
Of the 5.9 million observations we extracted, only 2.4% were published in properly labeled tables, suitable for automatic processing. 72% had to be reconstructed from the page’s text grid, 25% from the coordinates of individual words, because a table in PDF is technically not a table. 68% of the catalog’s publications are available as zip and rar archives, within which the document is split into dozens or hundreds of individual files, and the file names are saved in encodings from the 1990s.
Technically, all of this is open data. In practice, it’s an archaeological monument: to ask a simple question like “how did the number of doctors change by region?” you need to write an extractor program and spend weeks. We’ve done this and are publishing the code (see appendix) so that the next researcher doesn’t have to start from scratch.
9. What follows from thisFirst, there’s a logic to selectively obscuring official statistics: the one being checked is closedPhysical volumes, international comparisons, budget indicators—anything that can be verified with external sources or that cannot be artificially adjusted.
Second. The dates of the freezes coincide with political and sanctions events: August 2021 followed the EU’s sectoral sanctions, and spring-summer 2022 followed the full-scale ones. This isn’t departmental entropy. We have a control group of freezes from 2008–2011, and it looks completely different.
Third, and this is important for interpretation:The absence of data does not necessarily mean that it is a disaster.The case of doctors is direct proof of this: where we expected a collapse, official data showed a record. The reality turned out to be different: privatization, growth, and the concentration of doctors in the capital. Data manipulation hinders not only critics of the regime, but also those who would like to see good news in the figures.
Fourth. The darkness is not absolute. Some of the erased series are reconstructed using mirror statistics from partner countries—thus, we recovered the history of Belarusian electricity exports for years that are not available in any national publication. This is a practical answer to the question of what a researcher should do: look for data where others report on Belarus.
We’re recording three verifiable forecasts that will be verified automatically:
- The publication “Belarus in Figures, 2027” will revise the number of doctors for 2025 from 42,200 to approximately 50,000.
- The retrospective revision of fixed capital investment for 2025 will exceed 5%.
- New data portal freezes will continue to be concentrated in physical terms.
If these predictions are not confirmed, we will report that as well.
10. AppendicesA. Methodology and code.Five scripts (catalog collection, table extraction, inter-publisher diff, portal freshness audit, database upload) and a step-by-step runbook. Any figure from this article is reproducible from the original PDF to the final result.
B. Datasets.Stitched time series (values from the latest edition for each indicator and year); a freshness map of 915 data portal indicators; tables of retrospective edits and disappearances by series.
C. Limits of the method.Table titles in older collections are recognized heuristically, which can cause rows for a single indicator to split between editions (when citing, we verified each key figure against the original PDF). Row labels, reconstructed using word coordinates, are truncated in places. One PDF out of 19,000 could not be processed. The key energy balance table was extracted using the coordinate method and verified against the original PDF page by page. Discrepancies in mirror data for 2019 (1,509 versus 863 million kWh) were not resolved and are noted in the text. MICS survey indicators are excluded from the political cluster. Departmental statistics from the Ministry of Health (collections “Healthcare in the Republic of Belarus”) were not included in this analysis; they are the next mapping area.